- Home
- Outlook Arena
- Jan 8, 2010 - Key banking ratios: PSUs versus private
Key banking ratios: PSUs versus private
In one of our recent articles, we discussed about some of the key ratios relating to a bank's profit and loss statement. Just to brush up our readers, some of the ratios that were discussed included:
- Net interest margin (NIM)
- Cost to income ratio
- Other income to total income ratio
Net interest margins (NIMs): The difference between interest income and interest expense is known as net interest income. It is the income, which the bank earns from its core business of lending. As such, NIM is the net margin earned by the bank on its average earning assets. These assets comprises of advances, investments, balance with the RBI and money at call.
The proportion of low costs deposits (on which the bank pays interest) has a lot to do with this ratio. Particularly because banks that have been able to sustain or improve the proportion of low costs deposits would be able to garner higher NIMs. Low costs deposits are deposits in the form of current accounts and savings accounts (CASA).

|
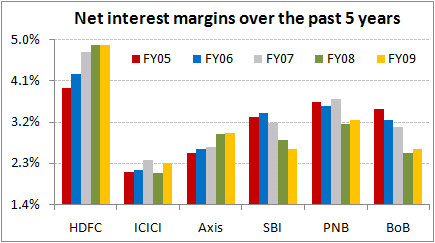
From the above chart we can see that the NIMs of leading public sector banks, namely State Bank of India (SBI), Punjab National Bank (PNB) and Bank of Baroda (BoB), have been historically higher than two of the leading private sector banks- ICICI Bank (ICICI) and Axis Bank (Axis). However, the NIMs of HDFC Bank (HDFC) are relatively much higher as compared to its peer group. This is due to the fact that HDFC Bank has sustained one of the highest proportions of CASA deposits in India.
Another trend we can notice is that the NIMs of private sector banks have been either improving or were quite stable. However, the story is not the same for the public sector banks. NIMs of the three leading banks have been either on a decline year after another or have been quite volatile. One of the possible reasons for the same would be of customers shifting to private banks for banking services.
Cost to income ratio: This ratio is calculated by dividing the operating expenses by the total income generated i.e.net interest income plus the other income. The lower the ratio, the better it is for a bank as it would help prop up its profit and return ratios.
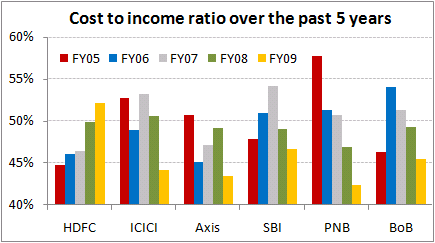
From the following chart we can see that the public sector banks have done well to reduce their costs (as a percentage of total income) over the past three to four years. However, the same cannot be said about all the private sector banks. While ICICI and Axis Bank have managed to bring down their expenses in recent times, HDFC Bank's costs have risen due to the higher expense ratio of Centurion Bank of Punjab that HDFC Bank acquired in FY08.

|
Further, for private sector banks, salaries have incrementally formed a larger part of operating expenses. If we compare similar data for a PSU bank such as SBI, the situation is different. Salary expenses stood at an average of 65% of operating costs during this period. This is no doubt a high number. But as we are comparing cost to income ratio, the same has improved on account of lower salary costs as a percentage of total operating costs. During FY05, salary costs formed about 68% of costs. This same stood at about 62% during FY09.
Other income to total income ratio: Other income largely constitutes of fee income such as commission, exchanges and brokerage fees. Banks in developed countries derive nearly 50% of revenues from this stream. For Indian banks, such fees contribute only about 15% -25% of the overall revenues.
Other income also includes profit on exchange transactions, profit from sale of investments, and other miscellaneous income, amongst others.

|
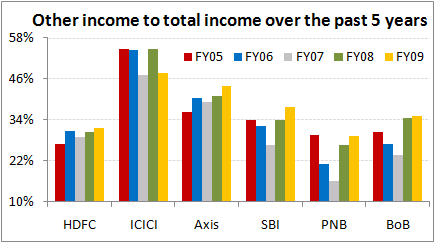
ICICI Bank clearly takes the cake in this one amongst private sector entities. On the other hand, public sector banks have done well to improve their other income to total income ratios in recent times.
However, it must be noted that fee income (and not total other income) of the public sector banks are relatively quite low. For instance, fee income for the three public sector banks stood at an average of about 15% (as a percentage of total income) during FY09. The same ratio for these three private banks stood at about 32% during FY09.
Conclusion
Looking at the above mentioned parameters, it does get a bit difficult to conclude whether public sector or private sector banks have performed better on an overall basis. In selected parameters -such as other income to total income ratio - private sectors are the clear winners. As for the cost to income ratios, the large public banks have done well to bring down expenses (as a percentage of total income) over the past few years. The same is not the case for all the private banks.
It is recommended that you must not be prejudiced towards investing in stocks of only public or only private sector banks. It is important to study these parameters, compare them to the peer group and also make sure that the stocks you pick meet your valuation criteria.
Equitymaster requests your view! Post a comment on "Key banking ratios: PSUs versus private". Click here!
2 Responses to "Key banking ratios: PSUs versus private"
Vinod
Jan 17, 2010Hi
Quite informative, however need more information like a) CASA growth year on year of leading pvt and public sectors banks.
b)Top 100 deposit locations (disctricts/city) wise number of branches of pvt sector banks and growth year on year.
c) Employee profitability year on year.
regards
vinod chawla


vishal
Jan 21, 2010good analysis.....
i feel, NPA % should also be evaluated, as default ratio could hamper the profitability of any of the financial institution......