- Home
- Views On News
- Feb 16, 2023 - Nifty IT Index: Out of the Red and into the Black
Nifty IT Index: Out of the Red and into the Black

When you think of a casino, the first destination that comes to mind is Las Vegas. If you think of a domestic destination, it's Goa.
As a holiday destination, Goa is famous for its beaches, seafood, nightlife, and of course, casinos. I'm sure many of you must have visited casinos at least once.
During my last visit to Goa with friends, we visited a casino, as usual. A couple of my friends placed bets on the Roulette table.
As it was a Friday night, the casino was fully crowded but only 10-15% of the visitors were betting. The rest were spectators.
I observed my friends betting on the roulette table. One of my friends was betting on multiple numbers and a few side bets. At that point in time, I realised the importance of diversification. You never know how your luck will play out.
So, after losing some money initially, we were left with a few free casino chips that you need to redeem to cash out.
I thought I would try my luck. I picked the number 27 as it was not on the list of the last 20 winning numbers.
Also being a Fibonacci trader for years, I thought 27 can be next as it is also a Fibonacci number.
It was my first ever bet on the roulette table. And hey, it was 27! Combined, we won Rs 17,600 on a bet of Rs 600. Betting on the odds can be very profitable.
I believe it's time to bet on the odds in the Indian stock market.
I would pick an underperformer turned outperformer - the Nifty IT index.
The index has been trending bearish since the start of 2022. Even the bluechip companies from the IT sector have suffered. So, investors have not preferred to invest in the IT sector.
I'm a reversal trader and here I'm going with the same theory of betting on 27 on the roulette table. Betting on the dark horse can pay out well.
The Indian IT sector is a follower of the Nasdaq 100 the US tech index. The technical setup on Nasdaq as well as the Indian IT index seems to be in a bottoming process.
If we look at the charts, the technical analysis theory of Wyckoff is visible on the Nasdaq and the Nifty IT index.
Nasdaq Index
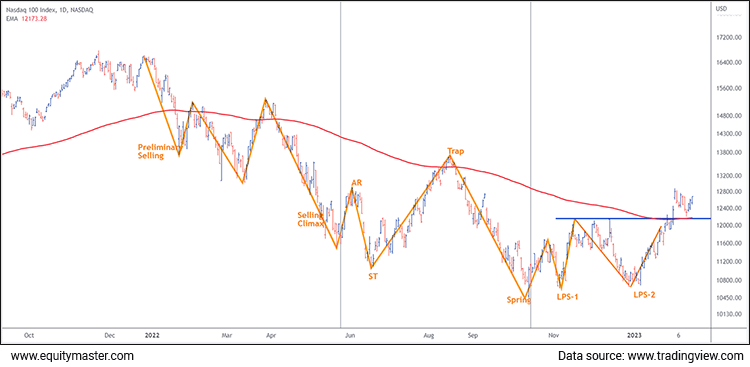
The Nasdaq is trading at 2-year lows of 10,440. It's down 35% from its all-time high of 16,764.
The reversal in the US markets on Tuesday this week signals the index has formed bottom with a higher low.
Nasdaq Daily Price Chart

As per Wyckoff's theory, the index has formed the Spring or Shakeout in October 2022, the lowest point of the accumulation phase.
The Wyckoff theory is based on the idea that the stock market is manipulated by professional traders, who use various tactics to influence the behaviour of retail investors and other traders.
The concept of "price action" as per theory involves analyzing the movements of a stock price and volume to identify trends, support and resistance levels, and other indicators of market sentiment.
The price action is influenced by the actions of "smart money" traders, who use a range of tactics to accumulate, distribute, or manipulate positions in a particular security or market.
The shakeout happens with the sharp reversal after hitting a new low. In this case, the Nasdaq index hit a new low of 10,440 and reversed above the 11,000 level.
An attempt in early January 2022 to break the lows went in vain but a failure resulted in the confirmation of Wyckoff's theory.
The index has managed to cross the 12,000 mark forming the higher high - higher low, bullish reversal as per Dow Theory.
Additionally, it is now trading above the long-term moving average of 200DEMA (Daily Exponential Moving Average) marking the bottom at 10,440.
As the Nifty IT index is a follower of the Nasdaq, let's analyse the chart.
Nifty IT Index Price Chart

A similar Wyckoff pattern is visible on the daily chart of the Nifty IT Index.
The index has hit the low of 26,186 and reversed sharply above the 31,000-mark.
As per the accumulation phases, the IT index has entered Phase D, termed bullish.
The low of 27,908 in January 2023 marks the Last Point of Support (LPS) which will be the low-risk - high-reward entry for the bulls.
The Nifty IT index has now breached the 41 weeks high and the horizontal resistance zone is indicating that it will be a leader of the markets.
The golden cross on the moving average signals the end of underperformance for the IT index.
The Golden Cross is a pattern in which a shorter-term moving average (50-day) crosses above a longer-term moving average (200-day). This pattern confirms a trend reversal for a long position in a stock or index.
To identify the strength of the Nifty IT index, we compared it with the Nifty50.
The ratio chart of Nifty IT / Nifty50 will highlight the outperformance and underperformance against each the other.
The ratio going higher. This means the Nifty IT index is outperforming against Nifty50 and vice versa.
Nifty IT Index / Nifty 50 Ratio Chart

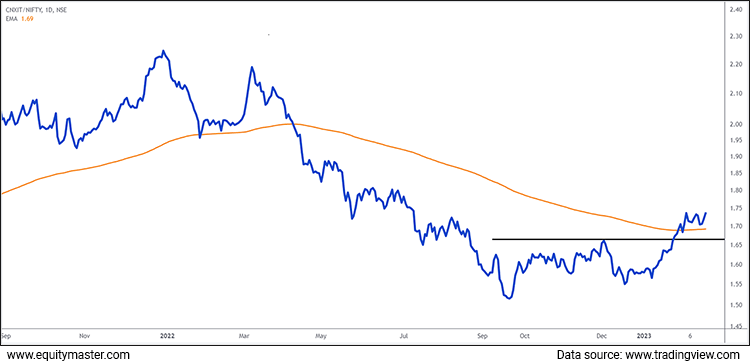
Since it's low in September 2022, the ratio chart has turned higher with a time correction.
The ratio chart broke below its long-term 200DEMA in April 2022 and continued to fall indicating an underperformance of the IT Index over Nifty50.
After trading below the average for 300 days, the ratio finally moved above the average marking the reversal on charts which means it is an underperformer turned outperformer.
With the Nasdaq trending bullish and the Nifty IT index trading at a 41 weeks high, investors and traders should look for IT stocks as and when they find opportunities.
I'll share more on his trend on my Telegram group. If you're interested in being part of my charting journey as I share how to create wealth from profitable trade setups, join my telegram channel - Fast Profits Daily.
In the meantime, check out the below video where I discuss an effective trading technique for making higher gains from IT stocks.
By the way, I had also highlighted why the IT sector is one of my top picks for 2023.
Safe Stocks to Ride India's Lithium Megatrend
Lithium is the new oil. It is the key component of electric batteries.
There is a huge demand for electric batteries coming from the EV industry, large data centres, telecom companies, railways, power grid companies, and many other places.
So, in the coming years and decades, we could possibly see a sharp rally in the stocks of electric battery making companies.
If you're an investor, then you simply cannot ignore this opportunity.
Details of our SEBI Research Analyst registration are mentioned on our website - www.equitymaster.comDisclaimer: This article is for information purposes only. It is not a stock recommendation and should not be treated as such. Learn more about our recommendation services here...

Brijesh Bhatia Research Analyst and expert chartist, is the editor of Alpha Wave Profits. Fully committed to his craft, Brijesh has mastered the art of making money by trading using technical analysis. Brijesh has an MBA from ICFAI and 16 years of experience in India's financial markets. He began his career on Dalal Street as commodities dealer and it wasn't long before he developed his own unique trading system. Brijesh worked on his trading system until it could be expected to deliver 5 units of return for every unit of risk.


Equitymaster requests your view! Post a comment on "Nifty IT Index: Out of the Red and into the Black". Click here!
Comments are moderated by Equitymaster, in accordance with the Terms of Use, and may not appear
on this article until they have been reviewed and deemed appropriate for posting.
In the meantime, you may want to share this article with your friends!