
MEMBER'S LOGINX
| Invalid Username / Password | ||||||||
| Invalid Captcha | ||||||||
|
||||||||
| Sign Up | Forgot Password? | ||||||||
- Home
- Views On News
- Feb 18, 2022 - Tata Elxsi vs L&T Technology Services: Which IT Stock is Better?
Tata Elxsi vs L&T Technology Services: Which IT Stock is Better?
When companies went global, outsourcing became a common practice as it helped them reduce their costs.
In outsourcing a company hires another party to get their work done instead of doing it in-house. For example, a small company might outsource their manufacturing to other party.
India's IT industry is possibly one of the best examples in the world of outsourcing. India has been the largest exporter of information technology services in the world.
For very long, Indian IT companies have been entrusted with handling low end business processes of many foreign companies.
To tap India's engineering prowess, many MNCs have asked Indian companies to solve their engineering problems, carry out research for them, design and develop innovative products and solutions.
Solving such complex problems is certainly not the forte of Indian IT companies such as TCS or Infosys.
Such projects are undertaken by pure play engineering companies such as Tata Elxsi and L&T Technology Services (LTTS). These companies fall in the category of engineering, research and development (ER&D) services.
Companies across the globe spent US$1.5 tn on ER&D in 2020. Global ER&D spend is expected to shoot up to US$ 2.6 tn by 2026.
Clearly, growth prospects of leading ER&D companies such as Tata Elxsi and LTTS looks bright. It might be a good idea to latch on to this opportunity to create wealth.
This article will compare Tata Elxsi and LTTS. Let's see which one you should keep your eye on.
General overview
Tata Elxsi and L&T Technology Services (LTTS) are among the leading engineering, research and development (ER&D) services providers in the world.
These companies offer a bouquet of services spanning the entire product development lifecycle such as research, design, development, testing. Simply put, these companies offer end to end engineering solutions to their clients.
Though Tata Elxsi and LTTS are predominantly software companies, they are different than the likes of TCS, L&T Infotech, and Infosys in two ways.
First, companies like Tata Elxsi and LTTS undertake complex design and engineering projects that require deep domain expertise.
Second, they operate higher up the value chain thereby making higher margins on the services offered.
Both these companies count some of the fortune 500 companies as their clients. These companies that Tata Elxsi and LTTS cater to are leaders in their respective industries.
How both companies fare on the revenue front
Tata Elxsi and LTTS caters to customers across several industries and geographies.
So, let's see some of the major industries these companies cater to and how much these industries contribute to their total revenue.
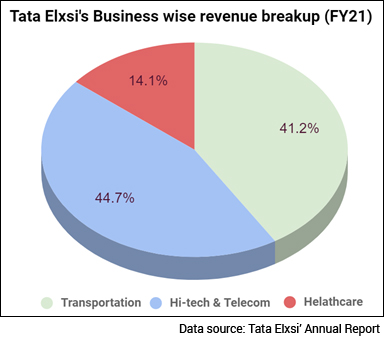
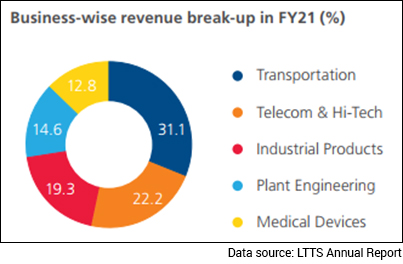
Industries such as transportation, telecom and healthcare are common to both the companies.
Infact, transportation and telecom contribute the most to the total revenue of both companies.
The following pie charts business wise revenue breakup for Tata Elxsi and LTTS respectively.
The following table shows the revenue of Tata Elxsi and LTTS over the last five years.
Revenue (Rs m )
| 2016-2017 | 2017-2018 | 2018-2019 | 2019-2020 | 2020-2021 | |
|---|---|---|---|---|---|
| Tata Elxsi | 12,373 | 13,863 | 15,969 | 16,099 | 18,262 |
| Growth (%) | 14.70% | 12.0% | 15.2% | 0.8% | 13.4% |
| 5 year CAGR | 8.1% | ||||
| LTTS | 32,483 | 37,471 | 50,783 | 56,191 | 54,497 |
| Growth (%) | 6% | 6.5% | 13.1% | 2.4% | -20.5% |
| 5 year CAGR (%) | 10.9% | ||||
Clearly, LTTS is way ahead than Tata Elxsi in terms of sales. Also, it's growing at a faster rate.
LTTS revenue has grown at a CAGR of 10.9% in the last five years whereas Tata Elxsi' revenue has grown at a CAGR of 8.1% during the same period.
Increased demand for digitisation has been driving LTTS' revenue growth. Share of digital engineering services to its total revenue has increased to 36.2% in 2020 from 18.5% in 2013.
The pandemic has catalysed digitisation across industries, and this bodes well for companies like Tata Elxsi and LTTS.
Operating Margins
Though LTTS leads in terms of revenue growth, Tata Elxsi races ahead in terms of operating margins.
The following table shows the margins of Tata Elxsi and LTTS for the last five years.
Operating Margins (%)
| OPM (%) | 2016-2017 | 2017-2018 | 2018-2019 | 2019-2020 | 2020-2021 |
|---|---|---|---|---|---|
| Tata Elxsi | 21.8 | 23.2 | 24.4 | 18.6 | 26.2 |
| 5 year average | 22.8 | ||||
| LTTS | 17.5 | 14 | 16 | 16.5 | 14.5 |
| 5 year average | 15.7 | ||||
Tata Elxsi' margins have been growing over years which is not the case with its peer LTTS.
Tata Elxsi has reported an average margin of 22.8% over the last five years whereas LTTS' margins averages out to be 15.7% over the same period.
An important point to note here is that Tata Elxsi and LTTS have customers across geographies such as North America, Europe, etc. As a result, these companies earn their revenue in numerous foreign currencies such as USD, GBP, Euro.
So, if rupee gains strength against any of these currencies then that would have a significant impact on margins.
These companies acknowledge the impact forex volatility on their margins. They have a hedging policy to subdue the shock of extreme volatility.
Dividend History
IT companies don't have to spend a lot on capex as they operate on an asset light business model. Tata Elxsi and LTTS both being IT companies are cash rich businesses.
Tata Elxsi had cash worth Rs 8.5 bn on its books for the year ended March 2021. On the other hand, LTTS had cash worth Rs 2.2 bn on its books.
Since they aren't required to spend on capex, they use this cash either for strategic investments or for dividends.
Dividends are a major source of income for many investors. Many investors tend to invest in companies that pay out hefty dividends.
Dividend per share and dividend payout ratio are two pointers that reflect best the dividend profile of any company.
The following table shows the dividend profile of Tata Elxsi and LTTS for the last five years.
Dividend details (Rs)
| Dividend per share (Rs) | 2016-2017 | 2017-2018 | 2018-2019 | 2019-2020 | 2020-2021 |
|---|---|---|---|---|---|
| Tata Elxsi | 8 | 11 | 13.5 | 16.5 | 48 |
| 5 year average | 19.4 | ||||
| LTTS | 6.75 | 15.54 | 20.7 | 20.7 | 21.79 |
| 5 year average | 17.1 | ||||
| Dividend Payout Ratio(%) | |||||
| Tata Elxsi | 28.5 | 28.5 | 29 | 40.1 | 81.2 |
| 5 year average | 41.46 | ||||
| LTTS | 58.8 | 65.7 | 46.1 | 68.5 | 39.3 |
| 5 year average | 55.68 | ||||
Tata Elxsi has been paying relatively higher dividends to its shareholders. Tata Elxsi paid an average dividend of Rs 19.4 in the last five years. During the same period, LTTS paid an average dividend of Rs 17.1.
However, LTTS performs better than Tata Elxsi in terms of payout ratio. LTTS' dividend payout ratio averages at 55.7% in the last five years whereas Tata Elxsi averages 41.5% during the same period.
A point to note here is that relatively lower dividend payouts by IT companies should not be considered a red flag as long as they can deploy the cash in the business at a healthy rate of return.
Valuation Ratios
Price to earnings (P/E) and price to book value (P/BV) ratios are valuation ratios used by analysts to determine whether a company is undervalued or overvalued
PE ratio signifies the amount of money a buyer is willing to pay for 1 rupee of company's earnings.
Similarly, P/BV signifies the amount of money a buyer is willing to pay for 1 rupee of company's book value.
The following table shows these ratios for Tata Elxsi and LTTS.
Tata Elxsi vs LTTS Valuation ratios (2016-2021)
| P/BV | 5 year average P/BV | P/E | 5 year averageP/E | |
|---|---|---|---|---|
| Tata Elxsi | 32.8 | 8.1 | 87.7 | 27.4 |
| LTTS | 14.0 | 5.9 | 53.8 | 22.2 |
Both companies are currently trading at a valuation higher than their five year average. This is because the market is discounting robust numbers that these companies may report going forward.
However, LTTS is relatively trading at a cheaper valuation.
Return on Equity (ROE)
ROE is one of the most important metrics to look out for while analysing companies. It tells us how much profit a firm generates for each rupee of shareholder equity.
For example, suppose a company invests Rs 100 of its own in the business. Let's say it generates Rs 50 on the money invested. In this case, ROE turns out to be 50%.
The following tables show the ROE of Tata Elxsi and LTTS in the last five years.
Tata Elxsi vs LTTS ROE (2016-2021)
| 2016-2017 | 2017-2018 | 2018-2019 | 2019-2020 | 2020-2021 | |
|---|---|---|---|---|---|
| ROE (%) | |||||
| Tata Elxsi | 31.3 | 32.5 | 30.8 | 23.5 | 27.2 |
| 5 year average | 29.06 | ||||
| LTTS | 29.2 | 26.9 | 31.4 | 30.1 | 19.4 |
| 5 year average | 27.4 | ||||
In the last five years, Tata Elxsi has generated an average ROE of 29% which is way better than the returns offered by fixed income instruments such as fixed deposits.
LTTS has also generated good returns on its shareholders money though little less than Tata Elxsi. LTTS average ROE stands at 27.4% in the last five years.
Debtor Days
Tata Elxsi has reported robust sales over the last five years. However, its high debtor days is a cause of concern.
What are debtor days?
It's a common practice for businesses to sell their goods and services on credit. A company may extend credit for a specific period, let's say 30 days or 60 days depending on the company's policies. So, the number of days it takes for a company to collect cash for the sales it has made on credit is known as debtor days.
Simply put, it measures how quickly a company can bring in cash for every sale it makes. The longer it takes for a company to collect, the greater the number of debtors' days and vice versa. High debtor days could pose liquidity issues for companies. Therefore, an investor should always remember that the lower the debtor days, the better it is.
Generally, IT companies have low debtor days. Take for example, TCS which takes only 7 days to collect cash after it sells its services.
However, in the case of Tata Elxsi, the number is really high.
The following tables show debtor days for Tata Elxsi and LTTS in the last five years.
Tata Elxsi vs LTTS Debtor Days (2016-2021)
| 2016-2017 | 2017-2018 | 2018-2019 | 2019-2020 | 2020-2021 | |
|---|---|---|---|---|---|
| Debtor Days | |||||
| Tata Elxsi | 722 | 807 | 815 | 890 | 804 |
| 5 year average | 807.6 | ||||
| LTTS | 80 | 94 | 76 | 90 | 83 |
| 5 year average | 84.6 | ||||
Tata Elxsi' average debtor days for the last five years stands at 807 days, that translates to more than 2 years.
LTTS does an excellent job in this regard. The company has an average debtor days of around 85 days in the last five years.
So, low debtor days is a major differentiator for LTTS.
Revenue per employee & attrition
For IT companies, employees are undoubtedly their biggest assets.
The revenue of IT companies is directly proportional to the efficiency of their employees. The more efficient employees are, the more revenue a company would make given that they are able to win projects.
Revenue per employee represents how much money a company makes on one employee. In a way it is a measure of an employee's efficiency.
Another employee related metric which is of paramount importance for IT companies is the attrition rate. This reflects the number of employees leaving the organisation with respect to the employees working in the company.
Let's see how Tata Elxsi and LTTS perform on these crucial parameters.
For the year ended March 2021, Tata Elxsi and LTTS had a total headcount of 7,362 and 16,000 employees, respectively.
Based on these numbers, Tata Elxsi' revenue per employee turns out to be Rs 2.5 m which is little lower than Rs 3.4 m LTTS makes on every employee.
It seems that either LTTS' employees are more efficient, or the company negotiates better terms with its clients for every employee it deploys on the project.
However, on the attrition front, Tata Elxsi does a better job than LTTS.
In the financial year 2021, Tata Elxsi reported an attrition rate of 6.6%, a decline of 360 basis points compared to the previous financial year.
However, for the quarter ended December 2021, Tata Elxsi has reported a sharp spike in its attrition levels.
For the same year, LTTS' attrition stood at 16.5%.
While for the quarter ended December 2021, the company reported attrition rate of 17.5%, a spike of 100 basis points since March.
Impact of Covid-19
As mentioned earlier, 2 or 3 industries contribute the most to the revenue of Tata Elxsi and LTTS. These key industries are transportation, telecom, healthcare.
Covid-19 had a direct impact on automobile sales. The demand for passenger vehicles and commercial vehicles fell drastically.
Due to weak demand, automobile manufacturers reduced their R&D expenditure as one of the measures to maintain liquidity. This in turn impacted the revenues of Tata Elxsi and LTTS.
Though demand for automobiles revived in the second half of fiscal 2020-21, shortage of semiconductor chips dampened the business momentum.
Tata Elxsi' revenue from the transportation sector declined 8% YoY while LTTS' revenue for the same period declined 13.3%.
However, telecom and healthcare industries covered up for the loss in the transportation sector to a large extent.
As work from home became the new norm, demand from the telecom industry surged thereby positively affecting the revenue. Healthcare obviously had a positive impact.
As the pandemic recedes, financials of Tata Elxsi and LTTS are gaining strong momentum.
Future prospects
The pandemic catalysed digitisation across industries and it is expected that digital tools and practices will proliferate further. This will open a world of opportunities for leading engineering services companies such as LTTS and Tata Elxsi.
Companies across the globe are investing in R&D to produce enticing products. Investments in R&D will only increase going forward. For ER&D companies such as LTTS and Tata Elxsi, this is a news to cheer. As per some analysts, the global ER&D market is going to expand to US$1.9 tn by 2025 from current US$1.4 tn.
LTTS and Tata Elxsi have drawn some plans to tap upcoming opportunities.
LTTS has identified 6 strategic areas where they would invest money in the following years. Some of these areas are electric, automated, and connected vehicles (EACV), 5G, Medical Electronics, AI & ML driven smart solutions, etc.
The company had invested in some of these areas well before they announced their plans. These investments bore fruition in the financial year 2021.
For example, they inaugurated an electric vehicle testing lab in Bengaluru, Karnataka to enable clients to verify the performance of the vehicle.
Engineers at LTTS created digital clones of their physical labs to cater their clients remotely and give them an enriching and immersive experience of their innovations hosted at the company's labs.
In the financial year 2021, LTTS won its largest ever deal of more than US$100 m from one of the leading oil and gas majors.
LTTS has acquired Orchestra technologies, a company based out of Texas, USA, to help 5G service providers with network management and optimisation solutions.
Now coming to Tata Elxsi, the company has acknowledged that it is highly over dependent on a handful of large customers. For the year ended March 2021, the company received almost 47% of its revenue from its top 10 customers. The company is diligently working to reduce client concentration and aims to diversify its revenue sources further.
Tata Elxsi has inaugurated global engineering center (GEC) with Schaeffler, a leading supplier of mechatronic solutions to the transportation industry. Tata Elxsi is a global engineering partner of Schaeffler, and GEC is part of a multi-year contract signed between them. This partnership reinforces Tata Elxsi's presence in Europe's automotive industry.
LTTS and Tata Elxsi have associations with world's leading tech companies such as Amazon and Google.
While LTTS has been authorised by Amazon to provide Alexa voice integration services, Tata Elxsi has been authorised by Google to offer content protection services under Google's 3PL certification program.
Equitymaster's View
We reached out to Tanushree Banerjee, Co-head of Research at Equitymaster to ask her view on IT companies. Here's what she had to say...
- Globally, the spend on engineering and design (E&D) by manufacturing companies, is seeing a huge surge.
The original equipment manufacturers (OEMs) have never really focused or invested in new-age electronics and software development.
They are, therefore, increasingly finding it favorable to outsource to specialised players. Global paucity of engineering and software talent for embedded systems, along with cost advantages (40-50% cost savings adjusted for productivity differences), strongly favors offshoring.
Additionally, the ticket nature of deals (sub-million dollar deals) associated with embedded product development is typically small. The market is relatively niche.
Hence it is not a major focus area for large Indian IT players like TCS and Infosys.
Thus, high growth potential, minimal penetration, and niche nature of this segment, sets the stage for multi-year exponential growth for focused players.
Which is better?
When compared on multiple metrics, both companies look equally good.
Tata Elxsi perhaps looks better due to higher operating margins, excellent dividend profile, and an impressive ROE.
However, high debtor days and client concentration is a red flag that investors should pay close attention to.
LTTS has more than 300 clients making its revenue mix highly diversified as compared to Tata Elxsi. The company is also trading cheaper when compared to Tata Elxsi's valuations.
However, operating margins continue to be a concern for the company. It's not such a big problem per se but it could keep the potential investors away from the stock if the company doesn't address it immediately.
Before you consider investing in any stock, check the fundaments and valuations of both companies. It plays an important role in deciding which is suitable for investment.
Still confused which is better?
Use Equitymaster's compare company tool for a detailed comparison between Tata Elxsi and LTTS. You can also use this tool to draw a detailed comparison of any two companies of your choice.
You can also compare both the companies with their peers.
For example,
Tata Elxsi vs KPIT Technologies
For a more detailed analysis, check out the financial factsheet of Tata Elxsi and LTTS.
You can also check out the latest quarterly results of Tata Elxsi and LTTS.
If stocks from the IT sector interest you, check out Equitymaster's powerful Indian stock screener tool to find the top IT companies in India.
Disclaimer: This article is for information purposes only. It is not a stock recommendation and should not be treated as such. Learn more about our recommendation services here...
Equitymaster requests your view! Post a comment on "Tata Elxsi vs L&T Technology Services: Which IT Stock is Better?". Click here!
4 Responses to "Tata Elxsi vs L&T Technology Services: Which IT Stock is Better?"
priti bhimani
Feb 19, 2022in my view both these companies should be looked at with a 3 years view and should invest equal amount in both companies.
ABOUT EQUITYMASTER
Since 1996, Equitymaster has been the source for honest and credible opinions on investing in India. With solid research and in-depth analysis Equitymaster is dedicated towards making its readers- smarter, more confident and richer every day. Here's why hundreds of thousands of readers spread across more than 70 countries Trust Equitymaster.
PREMIUM PRODUCTS
QUICK LINKS
POPULAR TOPICS
- Multibagger Penny Stocks
- Basics of Value Investing
- Benjamin Graham
- How to Invest in Gold
- How to Invest in Silver
- Best Stocks to Buy Today
- Best Small-cap Stocks to Buy
- Best Bluechip Stocks to Buy
- Guide to Penny Stocks
- How to Invest in the Share Market
- Warren Buffett - The Value Investor
- Pick the Best Multibagger Stocks
TRENDING TOPICS
 Donate to credible NGOs in the sector of your choice (ii) Claim 50% tax benefit u/s 80G (iii) Receive periodic reports.")
Copyright © Equitymaster Agora Research Private Limited.
Whitelist | Refer | Terms | Privacy | Contact | About | Sitemap
Equitymaster Agora Research Private Limited (Research Analyst)
SEBI (Research Analysts) Regulations 2014, Registration No. INH000000537.
103, Regent Chambers, Above Status Restaurant, Nariman Point, Mumbai - 400 021. India.
Telephone: +91-22-61434055. Email: info@equitymaster.com. Website: www.equitymaster.com.
CIN:U74999MH2007PTC175407
Name of the Compliance & Grievance Officer: Ms Sonal Ramachandran
Telephone: +91-22-61434003 | Email: compliance@equitymaster.com
LEGAL DISCLAIMER:
Investment in securities market are subject to market risks. Read all the related documents carefully before investing.
Registration granted by SEBI and certification from NISM in no way guarantee performance of the intermediary or provide any assurance of returns to investors.
All rights reserved. Any act of copying, reproducing or distributing this newsletter whether wholly or in part, for any purpose without the permission of Equitymaster is strictly prohibited and shall be deemed to be copyright infringement.
Equitymaster Agora Research Private Limited (Research Analyst) bearing Registration No. INH000000537 (hereinafter referred as 'Equitymaster') is an independent equity research Company. Equitymaster is not an Investment Adviser. Information herein should be regarded as a resource only and should be used at one's own risk. This is not an offer to sell or solicitation to buy any securities and Equitymaster will not be liable for any losses incurred or investment(s) made or decisions taken/or not taken based on the information provided herein. Information contained herein does not constitute investment advice or a personal recommendation or take into account the particular investment objectives, financial situations, or needs of individual subscribers. Before acting on any recommendation, subscribers should consider whether it is suitable for their particular circumstances and, if necessary, seek an independent professional advice. This is not directed for access or use by anyone in a country, especially, USA, Canada or the European Union countries, where such use or access is unlawful or which may subject Equitymaster or its affiliates to any registration or licensing requirement. All content and information is provided on an 'As Is' basis by Equitymaster. Information herein is believed to be reliable but Equitymaster does not warrant its completeness or accuracy and expressly disclaims all warranties and conditions of any kind, whether express or implied. Equitymaster may hold shares in the company/ies discussed herein. As a condition to accessing Equitymaster content and website, you agree to our Terms and Conditions of Use, available here. The performance data quoted represents past performance and does not guarantee future results.
Satya Pal Singh
Mar 1, 2023In my opinion Tata Elexi can give better returns to investors, though LTTS is also on strong footing...I would like to invest in both in equal ratio for at least 5 years time