- Home
- Views On News
- Mar 27, 2023 - Nifty Energy Index: Bulls Capitalizing on Technical Support
Nifty Energy Index: Bulls Capitalizing on Technical Support

The Nifty Energy index has corrected over 16% in the first two months of 2023 but the recovery in the month of March 2023 indicates that a reversal is on the cards.
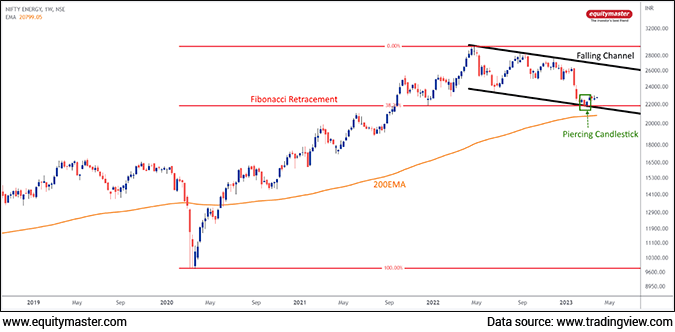
On the weekly chart, the index is trading at the confluence of support.
Nifty Energy Weekly Chart

- Falling Channel - The channel is formed by two parallel trendlines that slope downwards. The upper trendline represents the resistance level while the lower trendline represents the support level. The fall has halted at the support line of the channel.
- Fibonacci Retracement - Fibonacci retracement is a popular technical analysis tool used by traders to identify potential levels of support and resistance in a price trend. On the chart, the index has taken support at 38.20% Fibonacci level of the rise from March 2020 lows to the high of April 2022.
- Piercing Candlestick Pattern - The two-candlestick pattern indicates a shift in market sentiment from bearish to bullish. The reversal pattern forming at the support of the channel and Fibonacci retracement strengthens the reversal in trend.
- 200WEMA - The 200-week EMA is a widely watched indicator because it can provide valuable information about the long-term trend of an asset.
On the contrary, the Nifty50 is down around 1% in March 2023 while the Energy index gained over 5% indicating an outperformance.
Keep an eye on the constituents of the Nifty Energy index:
- Reliance Industries Ltd
- NTPC Ltd
- Power Grid Corporation of India Ltd
- Oil and Natural Gas Corporation Ltd
- Adani Green Energy Ltd
- Bharat Petroleum Corporation Ltd
- Tata Power Company Ltd
- Indian Oil Corporation Ltd
- GAIL (India) Ltd
- Adani Transmission Ltd
If you're interested in being part of my charting journey as I share how to create wealth from the profitable trade setups, join my telegram channel - Fast Profits Daily. You'll get access to the best trading ideas in the stock market.
Currently, the index is trading 0.1% lower. To know more about how the Nifty and Nifty Energy index are performing, please see the NSE Nifty Live Chart and Nifty Energy chart.
To know what's moving the Indian stock markets today, check out the most recent share market updates here.
Safe Stocks to Ride India's Lithium Megatrend
Lithium is the new oil. It is the key component of electric batteries.
There is a huge demand for electric batteries coming from the EV industry, large data centres, telecom companies, railways, power grid companies, and many other places.
So, in the coming years and decades, we could possibly see a sharp rally in the stocks of electric battery making companies.
If you're an investor, then you simply cannot ignore this opportunity.
Details of our SEBI Research Analyst registration are mentioned on our website - www.equitymaster.comDisclaimer: This article is for information purposes only. It is not a stock recommendation and should not be treated as such. Learn more about our recommendation services here...

Brijesh Bhatia Research Analyst and expert chartist, is the editor of Alpha Wave Profits. Fully committed to his craft, Brijesh has mastered the art of making money by trading using technical analysis. Brijesh has an MBA from ICFAI and 16 years of experience in India's financial markets. He began his career on Dalal Street as commodities dealer and it wasn't long before he developed his own unique trading system. Brijesh worked on his trading system until it could be expected to deliver 5 units of return for every unit of risk.


Equitymaster requests your view! Post a comment on "Nifty Energy Index: Bulls Capitalizing on Technical Support". Click here!
Comments are moderated by Equitymaster, in accordance with the Terms of Use, and may not appear
on this article until they have been reviewed and deemed appropriate for posting.
In the meantime, you may want to share this article with your friends!