
MEMBER'S LOGINX
| Invalid Username / Password | ||||||||
| Invalid Captcha | ||||||||
|
||||||||
| Sign Up | Forgot Password? | ||||||||
- Home
- Views On News
- May 8, 2023 - ITC Share Price: The Driving Force Behind FMCG Sector's Bull Run
ITC Share Price: The Driving Force Behind FMCG Sector's Bull Run
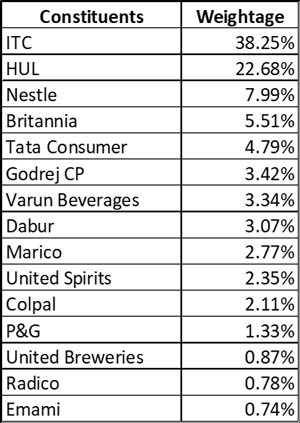
The Nifty FMCG index is trading close to its all-time high of 48,700. This is mostly due to its highest weightage constituent, ITC, hitting all-time highs every day.
ITC, with a weightage of 38% in the FMCG Index, significantly impacts its performance.
As one of the largest FMCG companies in India, ITC's strong financial performance and market dominance has made it a key player in the industry.
The company's diverse product portfolio, including popular brands such as Aashirvaad, Sunfeast, and Bingo! have made it a market leader.
In recent years, ITC has also made significant strides in sustainability and corporate social responsibility, which has further boosted its reputation and appeal among investors.
As long as ITC continues to perform strongly, it's likely the FMCG index will be buoyed by its weightage in the coming months.
Nestle and Radico are the other stocks from the basket that have managed to gain double digits in 2023.
We are witnessing the divergence in stock performance of the FMCG Index.
When such divergences occur, it's important for investors to thoroughly research and understand the underlying reasons and make informed decisions.
In some cases, it may be wise to invest in individual stocks within the index rather than the index as a whole, to capture the potential gains of the outperforming stocks.
However, investors should also be aware of the potential risks and volatility associated with investing in individual stocks.
The market breadth or the advance-decline ratio of the FMCG index on the weekly closing basis is 60% i.e., 9 out of 15 stocks in the FMCG index.
The advance-decline ratio is a measure used to assess the overall market sentiment and direction. It's calculated by dividing the number of stocks that have increased in price (advancing stocks) by the number of stocks that have decreased in price (declining stocks) over a period of time.
The resulting ratio can range from 0 to 1, with a value greater than 0.5 or 50% indicating advancing stocks outnumber declining stocks, and a value less than 0.5 or 50% indicating the opposite.
The chart speaks for itself
The FMCG index was one of the outperforming indices in the Indian markets with gains of 17%.
ITC, the leader in the index, gained 59% to close 2022 near an all-time high. The follow-up bullish momentum prolonged into 2023.
Nifty FMCG Weekly Chart
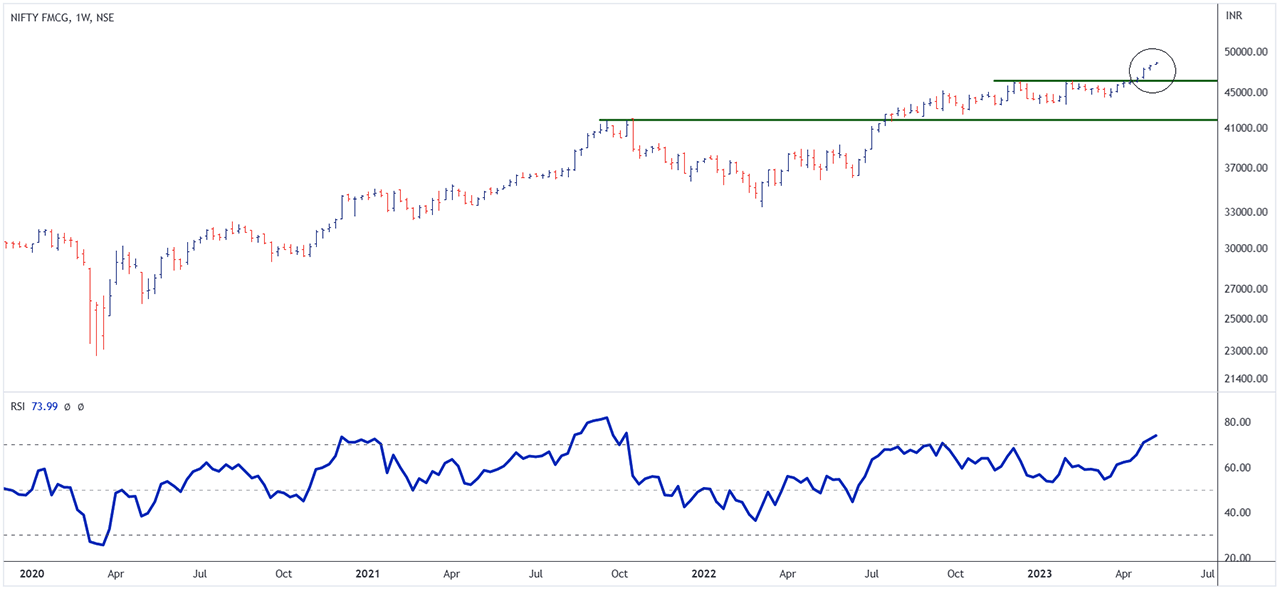
On the weekly chart, the index has broken out of its 18-weeks range as the previous high of 46,331-46,398 acted as a resistance zone.
A 52-week high breakout at the start of April 2023 signaled a resumption of the bullish trend in the index.
The 52-week high breakout is often viewed as a bullish signal by traders and investors because it suggests the stock has significant positive momentum and could potentially continue to rise in price.
The recent breakout indicates the bulls are in control of the momentum and ITC will continue to lead the index.
Investors and traders should understand the risk of a stock's performance in the index before investing in the index.
If you're interested in being part of my charting journey as I share how to create wealth from the profitable trade setups, join my telegram channel - Fast Profits Daily. You'll get access to the best trading ideas in the stock market.
Safe Stocks to Ride India's Lithium Megatrend
Lithium is the new oil. It is the key component of electric batteries.
There is a huge demand for electric batteries coming from the EV industry, large data centres, telecom companies, railways, power grid companies, and many other places.
So, in the coming years and decades, we could possibly see a sharp rally in the stocks of electric battery making companies.
If you're an investor, then you simply cannot ignore this opportunity.
Details of our SEBI Research Analyst registration are mentioned on our website - www.equitymaster.comDisclaimer: This article is for information purposes only. It is not a stock recommendation and should not be treated as such. Learn more about our recommendation services here...

Brijesh Bhatia Research Analyst and expert chartist, is the editor of Alpha Wave Profits. Fully committed to his craft, Brijesh has mastered the art of making money by trading using technical analysis. Brijesh has an MBA from ICFAI and 16 years of experience in India's financial markets. He began his career on Dalal Street as commodities dealer and it wasn't long before he developed his own unique trading system. Brijesh worked on his trading system until it could be expected to deliver 5 units of return for every unit of risk.
FAQs
Which are the top FMCG companies in India?
Based on marketcap, these are the top FMCG companies in India:
- #1 ITC
- #2 HINDUSTAN UNILEVER
- #3 NESTLE
- #4 GODREJ CONSUMER
- #5 BRITANNIA
You can see the full list of FMCG stocks here.
And for a fundamental analysis of the above companies, check out Equitymaster’s Indian stock screener which has a separate screen for best FMCG stocks in India.
Which are the top gainers and top losers within the FMCG sector today?
Within the FMCG sector, the top gainers were NATURO INDIABULL (up 9.6%) and AMBO AGRITEC LTD. (up 8.7%). On the other hand, MIC ELECTRONICS (down 2.7%) and ARCHIES (down 2.5%) were among the top losers.
For more, please visit the BSE FMCG index live chart and also check out our FMCG sector report.
How should you value FMCG companies?
Investing in stocks requires careful analysis of financial data to find out a company's true worth. However, an easier way to find out about a company's performance is to look at its financial ratios.
Two commonly used financial ratios used in the valuation of stocks are -
Price to Earnings Ratio (P/E) - It compares the company's stock price with its earnings per share. The higher the P/E ratio, the more expensive the stock.
Price to Book Value Ratio (P/BV) - It compares a firm's market capitalization to its book value. A high P/BV indicates markets believe the company's assets to be undervalued and vice versa.
To know more about the FMCG sector's past and ongoing performance, have a look at the performance of the Nifty FMCG Index and BSE FMCG Index.
ABOUT EQUITYMASTER
Since 1996, Equitymaster has been the source for honest and credible opinions on investing in India. With solid research and in-depth analysis Equitymaster is dedicated towards making its readers- smarter, more confident and richer every day. Here's why hundreds of thousands of readers spread across more than 70 countries Trust Equitymaster.
PREMIUM PRODUCTS
QUICK LINKS
POPULAR TOPICS
- Multibagger Penny Stocks
- Basics of Value Investing
- Benjamin Graham
- How to Invest in Gold
- How to Invest in Silver
- Best Stocks to Buy Today
- Best Small-cap Stocks to Buy
- Best Bluechip Stocks to Buy
- Guide to Penny Stocks
- How to Invest in the Share Market
- Warren Buffett - The Value Investor
- Pick the Best Multibagger Stocks
TRENDING TOPICS
 Donate to credible NGOs in the sector of your choice (ii) Claim 50% tax benefit u/s 80G (iii) Receive periodic reports.")
Copyright © Equitymaster Agora Research Private Limited.
Whitelist | Refer | Terms | Privacy | Contact | About | Sitemap
Equitymaster Agora Research Private Limited (Research Analyst)
SEBI (Research Analysts) Regulations 2014, Registration No. INH000000537.
103, Regent Chambers, Above Status Restaurant, Nariman Point, Mumbai - 400 021. India.
Telephone: +91-22-61434055. Email: info@equitymaster.com. Website: www.equitymaster.com.
CIN:U74999MH2007PTC175407
Name of the Compliance & Grievance Officer: Ms Sonal Ramachandran
Telephone: +91-22-61434003 | Email: compliance@equitymaster.com
LEGAL DISCLAIMER:
Investment in securities market are subject to market risks. Read all the related documents carefully before investing.
Registration granted by SEBI and certification from NISM in no way guarantee performance of the intermediary or provide any assurance of returns to investors.
All rights reserved. Any act of copying, reproducing or distributing this newsletter whether wholly or in part, for any purpose without the permission of Equitymaster is strictly prohibited and shall be deemed to be copyright infringement.
Equitymaster Agora Research Private Limited (Research Analyst) bearing Registration No. INH000000537 (hereinafter referred as 'Equitymaster') is an independent equity research Company. Equitymaster is not an Investment Adviser. Information herein should be regarded as a resource only and should be used at one's own risk. This is not an offer to sell or solicitation to buy any securities and Equitymaster will not be liable for any losses incurred or investment(s) made or decisions taken/or not taken based on the information provided herein. Information contained herein does not constitute investment advice or a personal recommendation or take into account the particular investment objectives, financial situations, or needs of individual subscribers. Before acting on any recommendation, subscribers should consider whether it is suitable for their particular circumstances and, if necessary, seek an independent professional advice. This is not directed for access or use by anyone in a country, especially, USA, Canada or the European Union countries, where such use or access is unlawful or which may subject Equitymaster or its affiliates to any registration or licensing requirement. All content and information is provided on an 'As Is' basis by Equitymaster. Information herein is believed to be reliable but Equitymaster does not warrant its completeness or accuracy and expressly disclaims all warranties and conditions of any kind, whether express or implied. Equitymaster may hold shares in the company/ies discussed herein. As a condition to accessing Equitymaster content and website, you agree to our Terms and Conditions of Use, available here. The performance data quoted represents past performance and does not guarantee future results.
Equitymaster requests your view! Post a comment on "ITC Share Price: The Driving Force Behind FMCG Sector's Bull Run". Click here!
Comments are moderated by Equitymaster, in accordance with the Terms of Use, and may not appear
on this article until they have been reviewed and deemed appropriate for posting.
In the meantime, you may want to share this article with your friends!