- Home
- Views On News
- Jun 21, 2022 - The Nifty Realty Index is in a Demand Zone. Charts Suggest it's the Right Time to Buy
The Nifty Realty Index is in a Demand Zone. Charts Suggest it's the Right Time to Buy
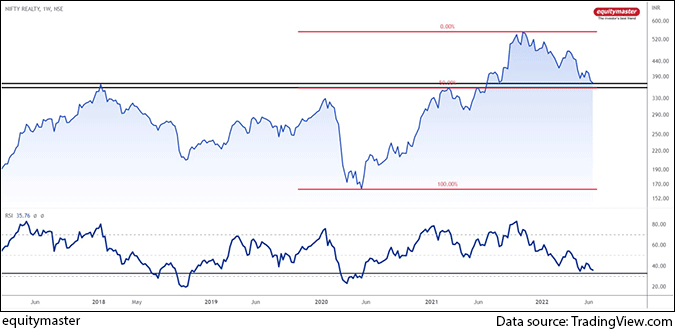
The Nifty realty index broke out of a 10-year consolidation in July 2021 at 370. It went on to hit the high of 560 in November 2021.
As the Indian share market corrected, the realty index is down 35% in the last 7 months.
The question on everyone's mind is, should you buy the dip?
Nifty Realty Index Weekly Chart

The charts are suggesting that the index is in a demand zone right now.
The 10-year consolidation breakout was re-tested at 370 giving investors an opportunity to accumulate the best stocks.
The black parallel lines on the weekly chart above indicate that the demand zone of 350-370, along with the 50% Fibonacci retracement level from the low of 160 to high of 560, is placed at 360.
Relative Strength Index (RSI) in the lower panel is approaching the buying level as the price is at a strong support zone.
Technically, the re-test of the breakout offers an excellent low risk - high reward trade setup.
Investors should grab this opportunity in realty stocks.
These are the Nifty realty index components which should be eyed:
- Brigade Enterprises
- DLF
- Godrej Properties
- Indiabulls RE
- Macrotech Developers
- Oberoi Realty
- Prestige Estates
- Sobha Developers
- Sunteck Realty
- The Phoenix Mills
At present, the Nifty realty index is trading up 1.7% at 377.
From the index, Oberoi Realty and Sunteck Realty are the top gainers. For more detailed updates, check the latest NIFTY Realty stock results.
I'll share more on his trend on my Telegram group. If you're interested in being part of my charting journey as I share how to create wealth from profitable trade setups, join my telegram channel - Fast Profits Daily.
Disclaimer: This article is for information purposes only. It is not a stock recommendation and should not be treated as such. Learn more about our recommendation services here...

Brijesh Bhatia Research Analyst and expert chartist, is the editor of Alpha Wave Profits. Fully committed to his craft, Brijesh has mastered the art of making money by trading using technical analysis. Brijesh has an MBA from ICFAI and 16 years of experience in India's financial markets. He began his career on Dalal Street as commodities dealer and it wasn't long before he developed his own unique trading system. Brijesh worked on his trading system until it could be expected to deliver 5 units of return for every unit of risk.


Equitymaster requests your view! Post a comment on "The Nifty Realty Index is in a Demand Zone. Charts Suggest it's the Right Time to Buy". Click here!
Comments are moderated by Equitymaster, in accordance with the Terms of Use, and may not appear
on this article until they have been reviewed and deemed appropriate for posting.
In the meantime, you may want to share this article with your friends!