
MEMBER'S LOGINX
| Invalid Username / Password | ||||||||
| Invalid Captcha | ||||||||
|
||||||||
| Sign Up | Forgot Password? | ||||||||
- Home
- Archives
Archives... Don't Miss Anything, Ever!
Here you will find all the research and views that we post on Equitymaster. Use the tools to customize the results to suit your preference!
 An Underdog Mid-Cap: The Next Big Winner?
Apr 16, 2024
The mid cap turnaround story that may take you by surprise.
 Top 5 Multibagger Stocks for 2024
Apr 16, 2024
Which stocks should be on your multibagger watchlist this year? Find out...
 Why HUL Share Price is Falling
Apr 16, 2024
HUL slumps 13% in three months, hits 52-week low. What's behind this bluechip stock slide?
 Top 10 Largecap Dividend-Paying Stocks to Keep an Eye on as Dividend Season Approaches
Apr 16, 2024
These ten cash rich companies have the potential to reward their shareholders with dividends in 2024.
 One of the Most Important Themes Playing out in the Indian Stock Market
Apr 16, 2024
Are you profiting from premiumisation?
 Why Captain Pipes Share Price is Falling
Apr 16, 2024
The company recently started work on its greenfield expansion in Ahmedabad, expected to complete by December 2024.
 Will the Stock Market Crash because of the Iran-Israel Conflict?
Apr 15, 2024
Could the latest crisis cause the stock market to fall? Find out...
 Why the Tata-Tesla Partnership is a Game-Changer for the Semiconductor Sector
Apr 15, 2024
Tesla diversifies its supply chain by making this Tata group company its strategic partner for semiconductor chips. What Next?
 Stocks to Profit from India's Transformer Gold Rush
Apr 15, 2024
The transformer is the new gold. These two pick and shovel stocks can be a part of your watchlist.
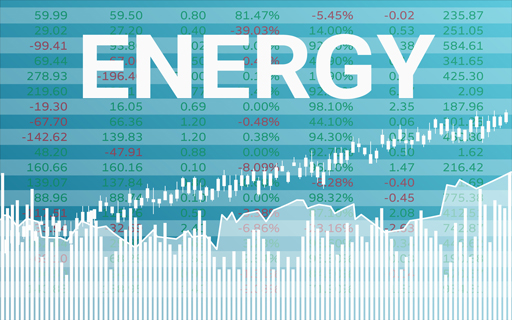 Top 3 Penny Stocks to Watch Out for in India's Booming Energy Sector
Apr 15, 2024
The increasing adoption of EVs, the expanding renewable energy market, and the development of cleaner technologies is creating a big opportunity for energy players.
 Top 5 Tata Group Stocks that Pay Good Dividends
Apr 14, 2024
Looking for blend of growth and passive income? Here are the top Tata Group companies with a strong track record of dividend payments.
 Hi-Tech Gears: The Auto Ancillary Stock That's Growing Like Tesla, up 87% in a Month
Apr 14, 2024
Nemish Shah, the man who took Infosys public, holds around 7.2% stake in this company.
 5 Midcap PSU Stocks That Tripled the Market's Return in FY24
Apr 14, 2024
Here are the best performing midcap stocks of FY24.
 Ashish Kacholia's Latest Portfolio Rejig: What's new?
Apr 13, 2024
Ace Investor adds exposure to one stock, cuts stake in two firms.
 Top 5 Specialty Chemical Stocks Poised for A Rebound
Apr 13, 2024
Despite near term headwinds, these five chemical stocks are primed for growth.
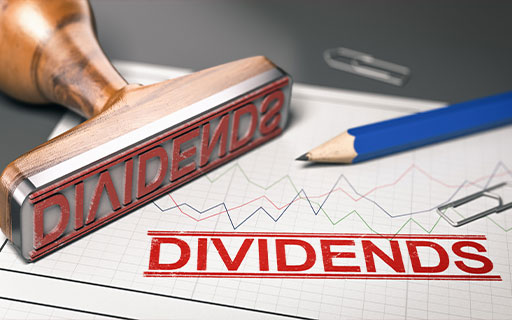 5 Stocks to Watch Out for Upcoming Dividends in May 2024
Apr 13, 2024
Looking for steady income streams? These 5 dividend champions are primed to pay out in May 2024.
 As Nifty Hits All Time High, We're Closely Tracking These 5 Stocks
Apr 12, 2024
What are the top stocks in the Nifty right now? Find out...
 This Tata Group Stock is Ramping up for a BIG Dividend Bonanza
Apr 12, 2024
This company never disappoints its shareholders and has an unmatchable dividend payout ratio in the industry.
 Will Biocon Lead Indian Pharma's Rare 'Patent Cliff' Opportunity
Apr 12, 2024
The last time such a cliff occurred during 2011-15 and offered substantial upside in pharma stocks.
 NOT IndiGo or SpiceJet... Vijay Kedia Picks Fresh Stake in this Multibagger Airline Stock
Apr 12, 2024
The Indian airline industry is booming, and Vijay Kedia recently picked a huge stake in this helicopter company. Is it poised to pop?
OUR TOP 5 IDEAS
OTHER USEFUL LINKS
MARKET STATS
ABOUT EQUITYMASTER
Since 1996, Equitymaster has been the source for honest and credible opinions on investing in India. With solid research and in-depth analysis Equitymaster is dedicated towards making its readers- smarter, more confident and richer every day. Here's why hundreds of thousands of readers spread across more than 70 countries Trust Equitymaster.
PREMIUM PRODUCTS
QUICK LINKS
POPULAR TOPICS
- Multibagger Penny Stocks
- Basics of Value Investing
- Benjamin Graham
- How to Invest in Gold
- How to Invest in Silver
- Best Stocks to Buy Today
- Best Small-cap Stocks to Buy
- Best Bluechip Stocks to Buy
- Guide to Penny Stocks
- How to Invest in the Share Market
- Warren Buffett - The Value Investor
- Pick the Best Multibagger Stocks
TRENDING TOPICS
 Donate to credible NGOs in the sector of your choice (ii) Claim 50% tax benefit u/s 80G (iii) Receive periodic reports.")
Copyright © Equitymaster Agora Research Private Limited.
Whitelist | Refer | Terms | Privacy | Contact | About | Sitemap
Equitymaster Agora Research Private Limited (Research Analyst)
SEBI (Research Analysts) Regulations 2014, Registration No. INH000000537.
103, Regent Chambers, Above Status Restaurant, Nariman Point, Mumbai - 400 021. India.
Telephone: +91-22-61434055. Email: info@equitymaster.com. Website: www.equitymaster.com.
CIN:U74999MH2007PTC175407
Name of the Compliance & Grievance Officer: Ms Sonal Ramachandran
Telephone: +91-22-61434003 | Email: compliance@equitymaster.com
LEGAL DISCLAIMER:
Investment in securities market are subject to market risks. Read all the related documents carefully before investing.
Registration granted by SEBI and certification from NISM in no way guarantee performance of the intermediary or provide any assurance of returns to investors.
All rights reserved. Any act of copying, reproducing or distributing this newsletter whether wholly or in part, for any purpose without the permission of Equitymaster is strictly prohibited and shall be deemed to be copyright infringement.
Equitymaster Agora Research Private Limited (Research Analyst) bearing Registration No. INH000000537 (hereinafter referred as 'Equitymaster') is an independent equity research Company. Equitymaster is not an Investment Adviser. Information herein should be regarded as a resource only and should be used at one's own risk. This is not an offer to sell or solicitation to buy any securities and Equitymaster will not be liable for any losses incurred or investment(s) made or decisions taken/or not taken based on the information provided herein. Information contained herein does not constitute investment advice or a personal recommendation or take into account the particular investment objectives, financial situations, or needs of individual subscribers. Before acting on any recommendation, subscribers should consider whether it is suitable for their particular circumstances and, if necessary, seek an independent professional advice. This is not directed for access or use by anyone in a country, especially, USA, Canada or the European Union countries, where such use or access is unlawful or which may subject Equitymaster or its affiliates to any registration or licensing requirement. All content and information is provided on an 'As Is' basis by Equitymaster. Information herein is believed to be reliable but Equitymaster does not warrant its completeness or accuracy and expressly disclaims all warranties and conditions of any kind, whether express or implied. Equitymaster may hold shares in the company/ies discussed herein. As a condition to accessing Equitymaster content and website, you agree to our Terms and Conditions of Use, available here. The performance data quoted represents past performance and does not guarantee future results.