The Bulls are Still in Control of the Nifty

Today I'll share my short term view on the Nifty.
I believe, despite the recent bearishness in the market, the Nifty is still in a bullish trend. In other words, the bulls are still in control of the Nifty.
Why do I say that?
Well, in this video, I'll show you, with the help of proven charts, why the trend is still up. I'll also tell you at what level on the Nifty this uptrend will reverse.
Watch the video and let me know your thoughts. I would love to hear from you.
Hello viewers. Welcome to the Fast Profits Daily. Myself Brijesh Bhatia.
Nifty has seen new milestones in 2021. We have been hitting new all-time highs Started with December Samvat 2077 last year Diwali, Nifty was hovering somewhere around 12,600-12,700 and though 2020 has seen a wild momentum, we had a corona fall, a V-shaped recovery, and since then, this year has been fantastic for the bulls. Most of the investment portfolios have seen amazing returns in last four five years.
Special Anniversary Offer: Vanishing Tomorrow - Your Chance to Save 80%
So if I just look at the Nifty 16,000. 17,000, 18,000 milestones have been achieved and it's up by around 40% since the last Diwali. Sensex is up by around 40% since last Diwali. We have seen 40,000, 50,000, 60,000 levels now onto the Sensex.
So if you look at it, still the structure of Nifty seems very, very bullish. In the recent last one week, 8 to 10 trading sessions, we have seen market have been slightly correcting from high levels. Nifty has seen around three, three and a half percent fall from higher levels. Midcaps and smallcaps have seen slightly more aggression in the profit booking, which are down by around 10-11% from their higher levels.
So again, it was a slight fear on D-street on the profit booking and this is the first time, the first time where the history is not repeating, which means that if you look at most of the fall or correction from the higher levels, the underperformers have been beaten aggressively, and this is the first time where underperformers remained constant. But the stocks, which had a huge run up, have seen a correction of around 20-25% from their higher levels. Be it IRCTC, be it Coforge, be it Naukri, there are a number of stocks which have corrected from higher levels like Berger Paints, Balrampur Chini, and any number of stocks.
So again, during this fall, the stocks which have seen a huge outperformance have corrected. What's the next, where we would think the Nifty is going? We think that Nifty is still in a strong bullish trend. First let's look at the weekly chart over here.

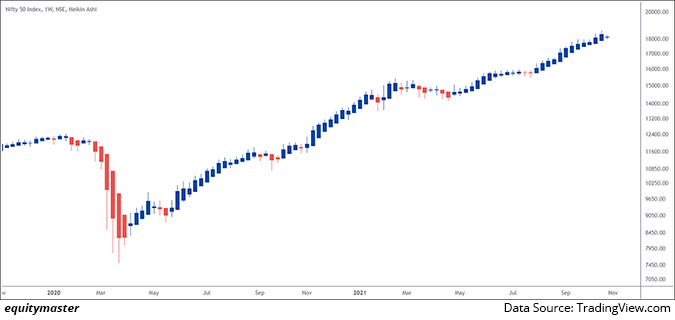
This is the Nifty Heikin Ashi weekly chart and this is the one chart which I every time follow when I want to look for a bigger picture or a bigger trend into the momentum.
So basically, the theory I follow. I've done a video on the same, the one chart investors should look at and if you go to our Equitymaster's YouTube channel, you will find that video.
The theory is very, very simple. When you see two Heikin Ashi bearish candles and the lows has been breached of those two Heikin Ashi bearish candles, the trend for me changes.
If you look at the whole scenario, we are still into the bullish territory, though we corrected and around three, three and a half percent from higher levels. But if look at the weekly Heikin Ashi candle charts, they are very, very bullish and there are no signs of fear as of now looking at the weekly chart of Heikin Ashi.
If you use it top down approach on to the technical charts, we started with weekly, now let's look at the daily chart and how it's panning out.

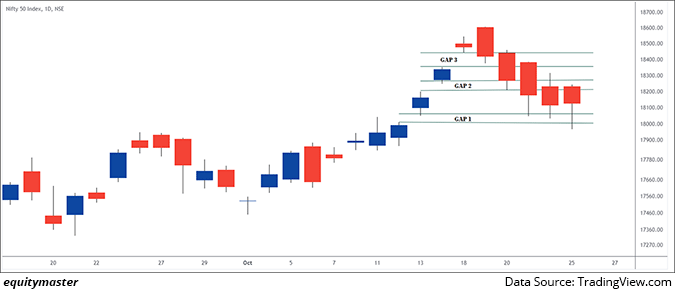
So you're if you look at the daily chart, we have seen a series of gaps when we broke above 18,000 levels. So if you look at the year, gap 1, gap 2, and gap 3. A consecutive three gaps where we have seen on the Nifty and all the gaps in the recent fall, right from 18,600 to 18,000 levels, have been filled now.
It is a said in technicals that the gaps fill. Again, that's a debatable topic over here that gaps do fill or not. In this case, the gaps have filled. The markets have taken support at the gap levels, and this is very, very important.
Again, all the gaps have been filled and the markets are showing signs of momentum. For me, the worry over here is bearish candles being informed. So right at the top, we have seen bearish engulfing, the three negative momentums, which indicates the three black crows, which is again a bearish sign.
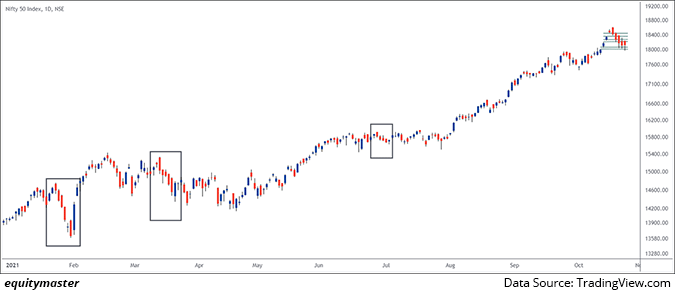
Again, this is not the first time that we have seen the bearish candles been forming out since the last one year. If you look at it since the start of 2021, let me show the chart over here.

This is not the first time that the bearish structure has formed on candle sticks especially. Since 2021, this is the fourth time the similar structure has formed and it's just a matter of time. Markets retrace after a strong rally. Again it resumes the bullish momentum and that's the case we have seen in the last three scenarios.
After forming a bearish candlestick structure over there, the market retraced slightly and` again, the most important, the previous lows were being held. Sometime it might happen that the breakout and retest has happened. In this case, the similar structure has happened. Let's move on from the daily chart now to the two hour chart.

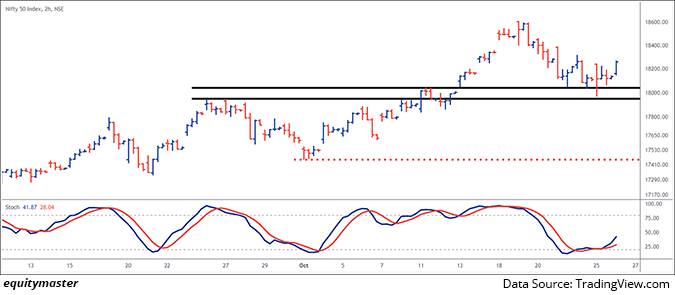
Again for me a good entry point of view from trading per se. If you remember, we started with weekly, where the primary trend has been identified. Then we went on to the daily chart, looking at the structure, and now we are moving in to the 2 hour chart over here. Look at the structure over here.
Most importantly, we broke out at around 17,950 levels, went the gaps up, three consecutive gaps, we retested, those 17,950 breakout levels, we made somewhere around a 17,980 low, and again the momentum resumed on the bullish side, reclaiming around 18,000 level also on an intraday basis.
So here, the breakout has been retested at 170,950-18,000 zone and which is very, very important. When this record retest happened and the price resumed, from a trading per se, this is a best risk-reward trade you can get on any chart.
So here, the breakout and retrace happened. We are again back towards 18,200-18,150 levels. If you look at the lower panel over here, the stochastics. Again, I am not using the traditional 5-3-3. Here I'm using 14-5-5 because I just not want to play just a momentum of 100-150 points. But I want to look for a fresh momentum starting after the retracement and if you look at the previous two over there, we made a retest, we made a bullish cross over, and the new trend momentum started.
Similarly if you look at recent levels, now, where we are above 18,000 levels, we are witnessing a positive crossover from the stochastics. Basically, stochastics is the momentum indicator, which is still showing that the bullish momentum is there onto the prices over here.
Now again, the only risk for me over here is the bearish three candles, the bearish three crows, and the bearish engulfing formed right at the top and once that is taken out, I believe that the momentum is still there for the bulls.
Though we might consolidate over here, for me, if you look at the red dotted lines over there, for me the trend change level for the Nifty over here is 17,400 levels, which were the previous lows.
So 17,300-17,400 till not broken down or we are not closing below those levels, I think still, there is a huge room for bulls, which can take Nifty onto the higher levels. As an investor, you need to keep the watch on the weekly Heikin Ashi candle. Again, the strategy as I said, is simple and the bearish Heikin Ashi are formed and the lows are being broken out, of the two consecutive bearish candles, the trend changes, which we have seen in 2020 and since then, we haven't seen such a structure happening.
So, you need to keep a watch on this and 17,300-17,400 till held, I think bulls are still in control. Retracements or dips should be a good accumulation level. Again, stocks would be debateable. What stock you should select. But for Nifty, I think the bulls are still in control of the markets and one should definitely look till 17300-17,400 is not breached, I believe that the bullish trend would continue on to the Nifty.
So signing off, but before I sign off, I request you to click on to the like button and click on the bell icon, so that you receive the notification as soon as we release the videos.
Signing off. Brijesh Bhatia. Thank you.
Warm regards,

Brijesh Bhatia
Research Analyst, Fast Profit Report
Equitymaster Agora Research Private Limited (Research Analyst)
Recent Articles
- Pyramiding PSU Bank Stocks September 22, 2023
- How to trade PSU banking stocks now.
- 5 Smallcap Stocks to Add to Your Watchlist Right Now September 12, 2023
- These smallcaps are looking good on the charts. Track them closely.
- Vodafone Idea - Can Idea Change Your Life? September 6, 2023
- What is the right way to trade Vodafone Idea?
- Repro Books Ltd: The Next Multibagger Penny Stock? August 28, 2023
- Is this the next big multibagger penny stock? Find out...


Equitymaster requests your view! Post a comment on "The Bulls are Still in Control of the Nifty". Click here!
Comments are moderated by Equitymaster, in accordance with the Terms of Use, and may not appear
on this article until they have been reviewed and deemed appropriate for posting.
In the meantime, you may want to share this article with your friends!