- Home
- Views On News
- Oct 29, 2022 - The Key Sector to Watch Out Next Week
The Key Sector to Watch Out Next Week
2022 has been one of the volatile years for Indian share markets.
Along with that, it also marks the year when the Indian indices emerged as one of the best performing indices globally.
Amid all the volatility, we are just a few percentage points away from hitting a new all-time high while most of the global indices are trading at 52-week lows.
Crude oil is one commodity which has kept most countries on their toes due to major swings from US$ 65 to US$ 129 and back to US$ 80.
One particular index which dances to the tune of crude oil prices is the Energy Index.
Energy Index - Technical Pattern

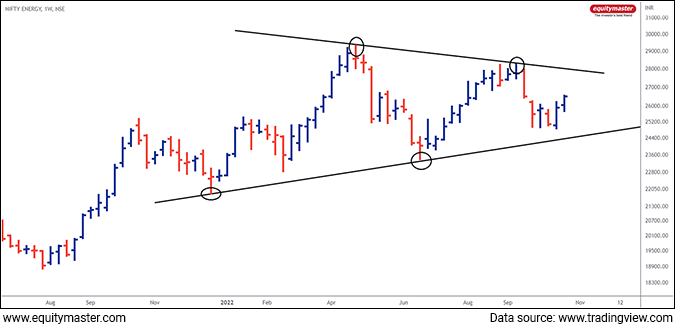
On the weekly bar chart, the index is trending in a symmetrical triangle pattern for a year now.
The recent bullish momentum in the index indicates the bulls are accumulating at the support area and it's likely to breakout upwards.
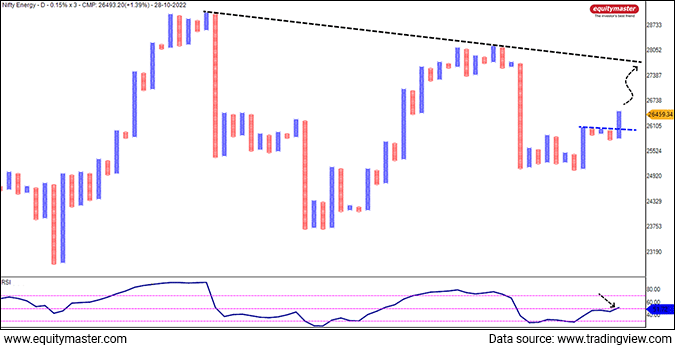
While on the Point & Figure (P&F) daily chart 0.15% X 3, the index has broken out of the consolidation zone, confirming the resumption of the bullish trend.
Additionally, the Relative Strength Index (RSI) in the lower panel has moved above 50, indicating the bulls are taking control of the momentum.

Energy stocks should be on every trader's watchlist for the coming week.
Weightage of Energy Index Constituents
Reliance Ind - 31.30%
NTPC Ltd - 13.29%
Power Grid - 11.23%
ONGC - 10.97%
BPCL - 9.89%
IOC - 8%
GAIL - 5.61%
HPCL - 4.95%
Tata Power - 2.45%
Adani Transmission - 2.29%
The energy index was last seen trading at 26,493 levels.
If you're interested in being part of my charting journey as I share how to create wealth from the profitable trade setups, join my telegram channel - Fast Profits Daily. You'll get access to the best trading ideas in the stock market.
To know more about how the Nifty and Bank Nifty index are performing, please see the NSE Nifty Live Chart and NSE Bank Nifty long term chart.
Disclaimer: This article is for information purposes only. It is not a stock recommendation and should not be treated as such. Learn more about our recommendation services here...

Brijesh Bhatia Research Analyst and expert chartist, is the editor of Alpha Wave Profits. Fully committed to his craft, Brijesh has mastered the art of making money by trading using technical analysis. Brijesh has an MBA from ICFAI and 16 years of experience in India's financial markets. He began his career on Dalal Street as commodities dealer and it wasn't long before he developed his own unique trading system. Brijesh worked on his trading system until it could be expected to deliver 5 units of return for every unit of risk.


Equitymaster requests your view! Post a comment on "The Key Sector to Watch Out Next Week". Click here!
Comments are moderated by Equitymaster, in accordance with the Terms of Use, and may not appear
on this article until they have been reviewed and deemed appropriate for posting.
In the meantime, you may want to share this article with your friends!