- Home
- Archives
Archives... Don't Miss Anything, Ever!
Here you will find all the research and views that we post on Equitymaster. Use the tools to customize the results to suit your preference!
 Bharti Hexacom: A Promising Play on India's Booming Telecom Market
Apr 18, 2024
Facing established players head-on, Bharti Hexacom takes a distinct approach, establishing a strong regional foothold.
 Expecting a BJP Victory? Which Stocks do You have in Your Watchlist?
Apr 18, 2024
If the BJP comes back to power, which stocks can be expected to do well? Read on...
 Wait for Tata Electronics IPO to Buy Semiconductor Stocks?
Apr 18, 2024
India's chip designers are already leading the pack in India's semiconductor ecosystem.
 Top 10 Fundamentally Strong Stocks Under Rs 100
Apr 18, 2024
These penny stocks have strong growth levers in place. Take a look...
 Stocks to Ride India's Semiconductor Opportunity
Apr 17, 2024
Lesser known stocks in the semiconductor value chain.
 Ace Investor Vijay Kedia Checks into this Multibagger Hotel Stock. Will it be a Profitable Vacation?
Apr 17, 2024
Here's why the seasoned investor added this hotel stock that has gained 100% in a year.
 This Smallcap Stock Could Profit from India's EV, Transformer, and Data Centre Gold Rush
Apr 17, 2024
This company has an established market position with one-third market share in the domestic transformer oil and white oil segments.
 Best NBFC Stock: Bajaj Finance vs Bajaj Finserv
Apr 17, 2024
As NBFCs continue to garner a large share of the credit economy, we compare the two market leaders on key metrics like growth and profitability.
 Radhakishan Damani Books Profit in Multibagger Tata Stock. Should You Too?
Apr 17, 2024
Shares of this company have rallied over 190%, making it one of the best performing Tata stocks of FY24.
 Are Green Hydrogen Stocks on Your Watchlist?
Apr 17, 2024
The quest to hit net zero has generated huge interest in green hydrogen.
 An Underdog Mid-Cap: The Next Big Winner?
Apr 16, 2024
The mid cap turnaround story that may take you by surprise.
 Top 5 Multibagger Stocks for 2024
Apr 16, 2024
Which stocks should be on your multibagger watchlist this year? Find out...
 Why HUL Share Price is Falling
Apr 16, 2024
HUL slumps 13% in three months, hits 52-week low. What's behind this bluechip stock slide?
 Top 10 Largecap Dividend-Paying Stocks to Keep an Eye on as Dividend Season Approaches
Apr 16, 2024
These ten cash rich companies have the potential to reward their shareholders with dividends in 2024.
 One of the Most Important Themes Playing out in the Indian Stock Market
Apr 16, 2024
Are you profiting from premiumisation?
 Why Captain Pipes Share Price is Falling
Apr 16, 2024
The company recently started work on its greenfield expansion in Ahmedabad, expected to complete by December 2024.
 Will the Stock Market Crash because of the Iran-Israel Conflict?
Apr 15, 2024
Could the latest crisis cause the stock market to fall? Find out...
 Why the Tata-Tesla Partnership is a Game-Changer for the Semiconductor Sector
Apr 15, 2024
Tesla diversifies its supply chain by making this Tata group company its strategic partner for semiconductor chips. What Next?
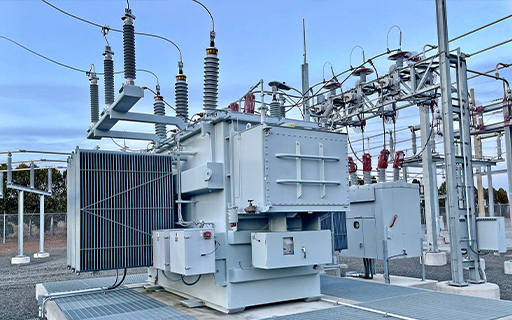 Stocks to Profit from India's Transformer Gold Rush
Apr 15, 2024
The transformer is the new gold. These two pick and shovel stocks can be a part of your watchlist.
 Top 3 Penny Stocks to Watch Out for in India's Booming Energy Sector
Apr 15, 2024
The increasing adoption of EVs, the expanding renewable energy market, and the development of cleaner technologies is creating a big opportunity for energy players.

