- Home
- Views On News
- Nov 28, 2022 - Nifty Energy Index - Adding Fuel to the Fire
Nifty Energy Index - Adding Fuel to the Fire

The Nifty Energy index has remained silent and showed a muted performance in November 2022 with marginal gains of 0.4%.
This compares with gains of over 3% for the benchmark Nifty.
Recently, bullish momentum can be seen in the index. If we look at individual stocks, Reliance Industries is leading the way.
With a weightage of 31% in the Nifty Energy Index and 10% in the Nifty, the stock is leading the way to new highs.
Nifty Energy Index Constituents
| Constituents | Weights |
|---|---|
| Reliance Industries | 31.30% |
| NTPC | 13.29% |
| Power Grid | 11.23% |
| ONGC | 10.97% |
| BPCL | 9.89% |
| IOC | 8.00% |
| Gail | 5.61% |
| HindPetro | 4.95% |
| Tata Power | 2.45% |
| Adani Transmission | 2.29% |
As energy stocks are gaining bullish momentum and leading the market higher. Which stocks can support Reliance Industries and what is the chart of the Nifty Energy Index indicating?
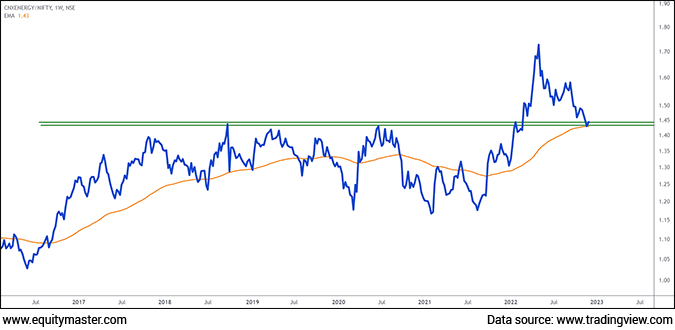
Before I head to the chart of the Nifty Energy index, I would like to highlight the ratio chart of Nifty Energy Index / Nifty 50 to gauge the outperformance and underperformance of the energy index over the Nifty.
Nifty Energy Index / Nifty50 Weekly Ratio Chart

The ratio chart is a tool to identify the outperformance and underperformance of one instrument over other.
In the chart above, we are measuring the performance of the Energy Index over the Nifty 50.
The Energy Index and Nifty 50 swung up and down during 2017-2022 before breaking out on the chart.
The breakout and the ratio heading northward, means the energy index is outperforming the Nifty 50.
Since its breakout in February 2022, the ratio chart between February and May was led by Reliance Industries.
The breakout has been retested back in November 2022 and Reliance Industries awakened with bullish momentum.
The ratio chart indicates it's the best time to invest in energy stocks.
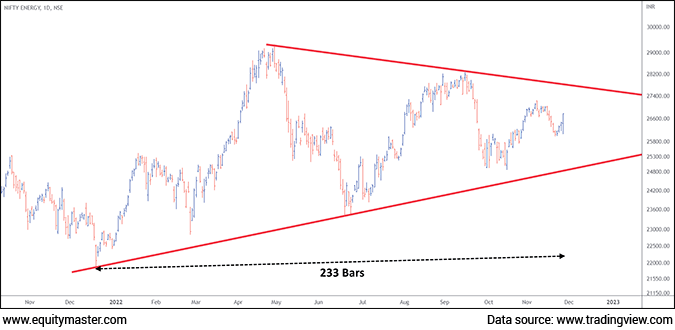
Nifty Energy Index / Nifty50 Weekly Ratio Chart

As the ratio chart is indicating the bullish tone for the energy index, so is the Fibonacci Time Cycle theory.
Since December 2021, the index is trending in the symmetrical triangle pattern on the daily chart (marked red).
As per the Fibonacci Time Cycle theory, the momentum in the index begins on 233 bars or trading days since the start of the triangle.
The beginning of the trend on the Fibonacci Time Cycle Day highlights the index is headed for a bullish breakout and eventually, a new all-time high. The current all-time high is 29,304 and the index is trading at around 26,800.
Investors and traders should keep energy stocks on their radar for the next 3-6 months.
If you're interested in being part of my charting journey as I share how to create wealth from the profitable trade setups, join my telegram channel - Fast Profits Daily. You'll get access to the best trading ideas in the stock market.
Safe Stocks to Ride India's Lithium Megatrend
Lithium is the new oil. It is the key component of electric batteries.
There is a huge demand for electric batteries coming from the EV industry, large data centres, telecom companies, railways, power grid companies, and many other places.
So, in the coming years and decades, we could possibly see a sharp rally in the stocks of electric battery making companies.
If you're an investor, then you simply cannot ignore this opportunity.
Details of our SEBI Research Analyst registration are mentioned on our website - www.equitymaster.comDisclaimer: This article is for information purposes only. It is not a stock recommendation and should not be treated as such. Learn more about our recommendation services here...

Brijesh Bhatia Research Analyst and expert chartist, is the editor of Alpha Wave Profits. Fully committed to his craft, Brijesh has mastered the art of making money by trading using technical analysis. Brijesh has an MBA from ICFAI and 16 years of experience in India's financial markets. He began his career on Dalal Street as commodities dealer and it wasn't long before he developed his own unique trading system. Brijesh worked on his trading system until it could be expected to deliver 5 units of return for every unit of risk.
Equitymaster requests your view! Post a comment on "Nifty Energy Index - Adding Fuel to the Fire". Click here!
1 Responses to "Nifty Energy Index - Adding Fuel to the Fire"


RamaRao
Nov 30, 2022Dear Sir,
Thanks for the Report. Is there any ETF or soe other instrument (other than individual stock components) thru which we can take exposure to NIFT ENERGY INDEX.