Buy Auto Stocks for Momentum Trading

If you've been active in the stock market recently, you would have noticed auto stocks doing well.
All the big auto names, after a period of underperformance, are now outperforming the Nifty.
Will this momentum continue? I think so.
In this video, I'll show you why auto stocks are good bets right now.
Watch the video and let me know your thoughts about auto stocks in the comments.
Hello, viewers. Welcome to the Fast Profits Daily. Myself Brijesh Bhatia.
Well Nifty has been reclaiming around 18,000 levels now, from the 16,500 levels. We are coming back very, very strongly and if you look at the Dow Jones, it's trading near the all-time high level.
As we follow the global markets, it is that we catch up with the performance of the momentum, into the Dow Jones now and we might not be surprised if we head towards the new all-time high as well.
Don't Miss: Best Chance to Access Midcap Stocks Research at 80% OFF
One sector where I think the momentum is very, very strong and if you look at the auto space over here, it has being trending very, very strongly on the bullish side. We saw Tata Motors coming up very, very strongly, since the lows from the two wheelers, Bajaj Auto, Hero Motors. They're coming up very, very strongly. Maruti reclaiming 8,000 levels back again now. So I think the momentum is still continuing their into the auto space.
Let's look at what the charts are indicating to us. Before that if you look at the auto space last year, it was slightly underperforming the Nifty. The Nifty was up about 24% last year, whereas if you look at the auto index, it was about 18-19% higher.
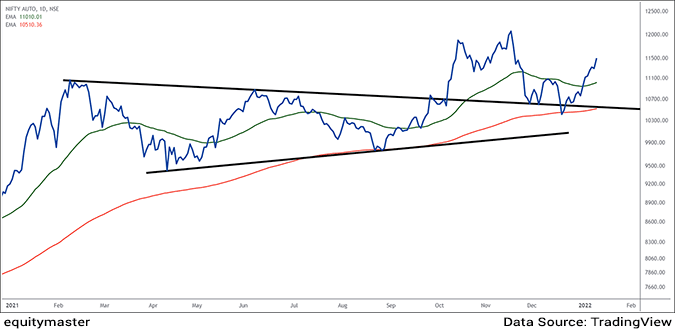
If you remember 2017-18 highs, somewhere around 12,050-12,100 levels were acting as a resistance in 2021. Though we hit new all-time high of around the 12,138, still we are slightly lower at around 11,400 levels.
I think this momentum might take the CNX auto index to the all-time high now and it's been underperforming against the Nifty in 2021. So I believe the momentum is very, very strong this time and it might take it to the all-time high.

Let's look at the chart over here. This is the auto index chart, and if you look at it, it consolidated in a form of a triangle structure for a long, long time. It broke out in October 2021, went higher, re-tested the breakout level, forming the double bottom structure.
Now, if you look at the red line over here, it's the 200 days exponential moving average. It took about right at the 200 days exponential moving average which is a long term average, and when the trend is very, very strong, and it re-tests the 200 days exponential moving average, and moves higher, it gives a strong conviction that the strength in the trend is still there into the market.
Well to confirm, I waited for it to move above the short term moving average which is the 50 days. So if you look at the green line over here, it is 50 days exponential moving average, and last week, at the start of January 2022, we broke above those levels as well, confirming that the 200 days test was a sign of the strong bullish trend.
We broke out above the short term moving average, which is the 50 and do remember that when the golden ratios are being used, the 50 and 200 days average, we have already crossed above 200 days, the golden ratio, were-tested 200, we are now above the 50 days exponential moving average, indicating the trend is very, very strong over here.
So even if you look at the long term trend line, the triangle structure, it re-tested the 200 days average. Re-testing and moving higher is a sign of strong strength of momentum. Will it outperform the Nifty now?

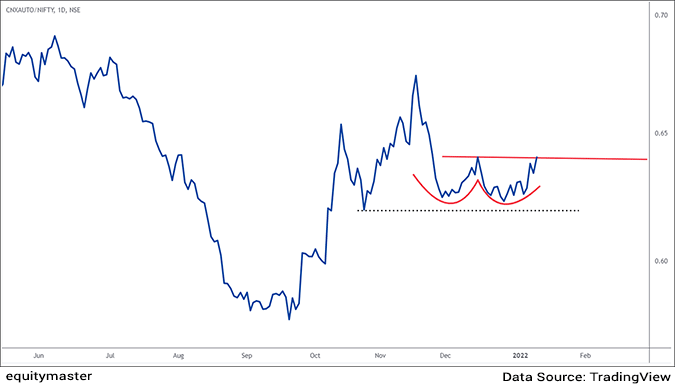
Well let's look at the comparison chart which is the ratio chart over here. So the second chart which I'm using is the CNX Auto to Nifty ratio chart over here. So what I'm doing is I'm comparing Auto performance, CNX auto, which is Nifty Auto index performance, with the Nifty over here.
Now, if you look at a restructure, it is forming the double bottom structure over here. Now it re-tested somewhere around 0.62-0.63 for a couple of times, back toward 0.65 levels now. And if you look at the double bottom structure which is forming near the previous lows, which is the black dotted line, indicates that the basing structure has happened into the ratio chart.
Now it's time that auto index will outperform against in Nifty and double bottom is a sign where it forms the huge basing structure and then the momentum begins. So we are on the cusp of breaking out of the double bottom structure right at the neckline.
Today's momentum is very, very a strong into the auto space, and I believe this double bottom could be taken out in a swift manner and we might see for next 1 to 2 months the auto index strongly outperforms against the Nifty.
So keep a watch on this auto space from a trading idea, and I believe sooner or later, we might see new all-time highs coming into the auto index. Now we are trading somewhere around the 11,400 levels. All-time high was 12,138. We might surpass those levels sooner or later in the auto index and you should not miss this momentum into the auto space.
Signing off, Brijesh Bhatia.
Warm regards,

Brijesh Bhatia
Research Analyst, Fast Profit Report
Equitymaster Agora Research Private Limited (Research Analyst)
Recent Articles
- Pyramiding PSU Bank Stocks September 22, 2023
- How to trade PSU banking stocks now.
- 5 Smallcap Stocks to Add to Your Watchlist Right Now September 12, 2023
- These smallcaps are looking good on the charts. Track them closely.
- Vodafone Idea - Can Idea Change Your Life? September 6, 2023
- What is the right way to trade Vodafone Idea?
- Repro Books Ltd: The Next Multibagger Penny Stock? August 28, 2023
- Is this the next big multibagger penny stock? Find out...


Equitymaster requests your view! Post a comment on "Buy Auto Stocks for Momentum Trading". Click here!
Comments are moderated by Equitymaster, in accordance with the Terms of Use, and may not appear
on this article until they have been reviewed and deemed appropriate for posting.
In the meantime, you may want to share this article with your friends!