
Is this the Beginning of the End for IT Stocks?

This is one the more important videos I've done because I'm actually calling for a trend reversal.
I've been bullish on IT stocks so far and these stocks have done very well.
But things are changing. The charts don't look so positive anymore.
So is it time for you to turn bearish on IT stocks?
Find out in this video...
Hello viewers. Welcome to the Fast Profits Daily. Myself Brijesh Bhatia.
In this video, we will be discussing about the IT sector. Is it the beginning of the end for the IT sector?
Revealing on April 30: Are You Ready for the Upcoming Election Surprise?
Well, a couple of weeks back the IT index fell by nearly 7% though it tried to recover around 3% from the lows.
But if I look at the NASDAQ chart, generally the Indian IT Index it follows the NASDAQ chart which is the US index comprising mor than the IT components. Generally IT follows its footsteps. So let's look at the NASDAQ chart. What is it indicating? First, let's look at the weekly chart of the NASDAQ.
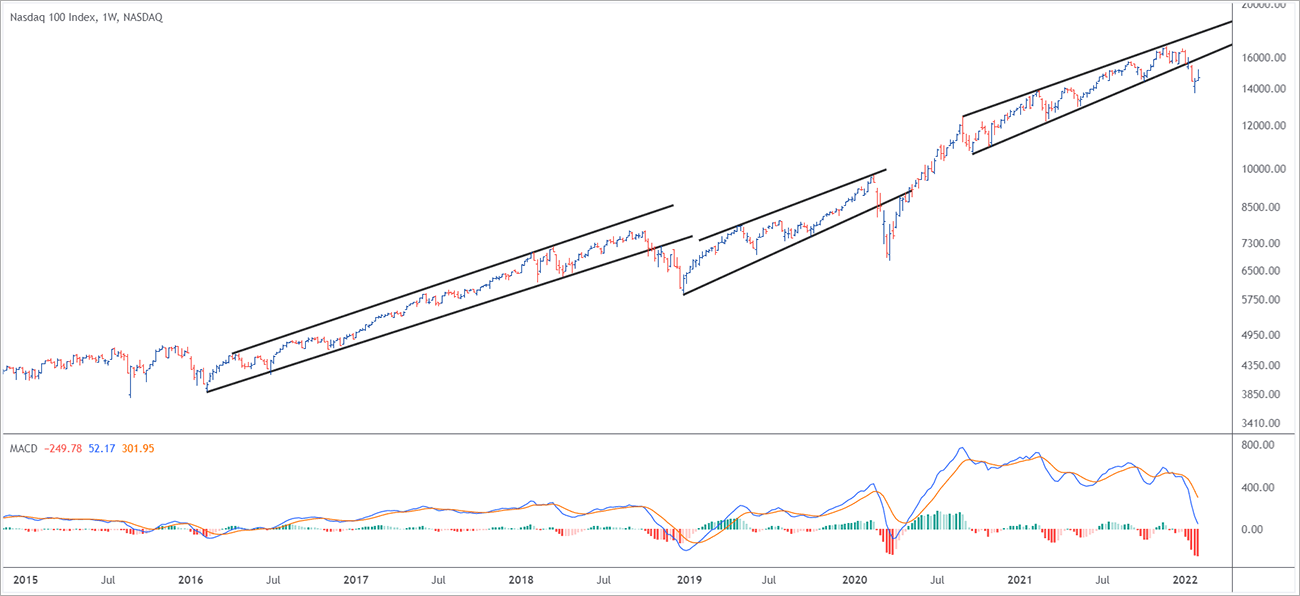
If you look at this NASDAQ weekly chart right from 2016, it trends in a rising channel structure a couple of times and when the breakdown happens it has corrected severely.
We'll look at the percentage of momentum that has been seen of the downside. But if you look at the lower panel over here, the MACD, whenever this breakdown happens, and there is a negative crossover of averages on MACD, the momentum strengthens on the bearish site.
We have seen right into 2019-20 right before the covid fall and again in 2022, we are witnessing the similar structure happening in the NASDAQ. If I look at the fall now, look at the momentum over here.
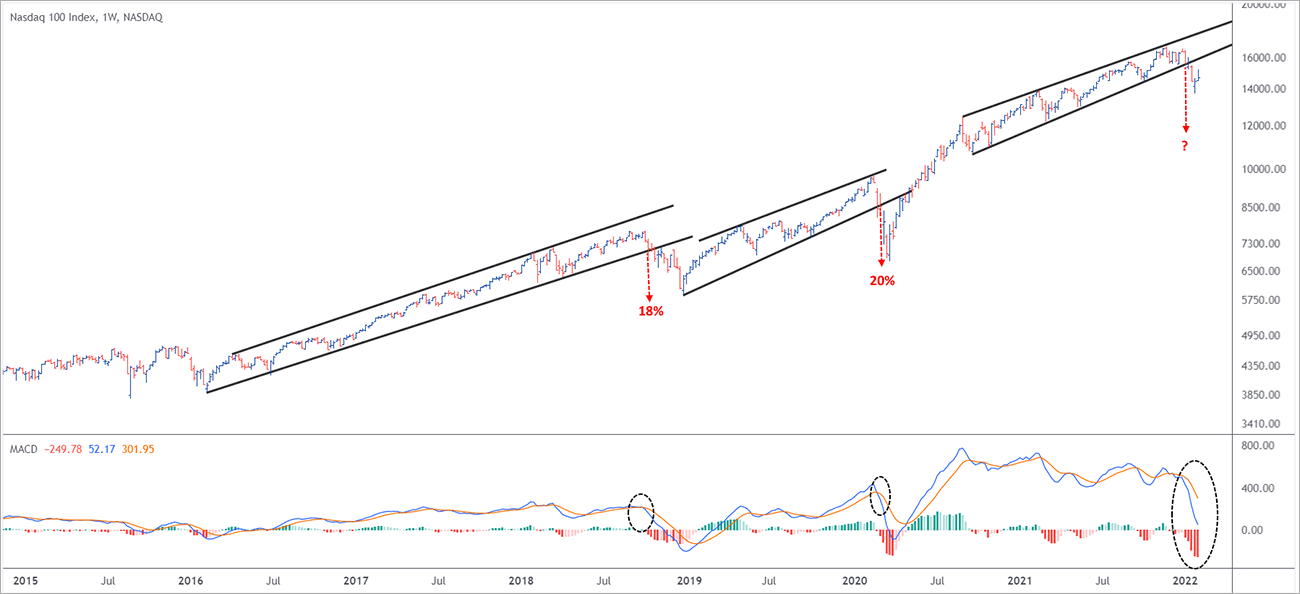
The previous fall was around 18%. The second fall was somewhere around 20%. This is the third time we are seeing a breakdown and the MACD look at the negative crossover. As I highlighted, when that happens the momentum is fast and furious.
If you look at the breakdown a couple of weeks back, though there is a recovery but if you remember the last Thursday's and Friday's sessions, the gains were slightly a took off by bears. And in the end, it ended near the lower levels. When the candlesticks ends below the lower level below the 50% mark, it's generally painted as the bear's failure. And this would happened in the NASDAQ.
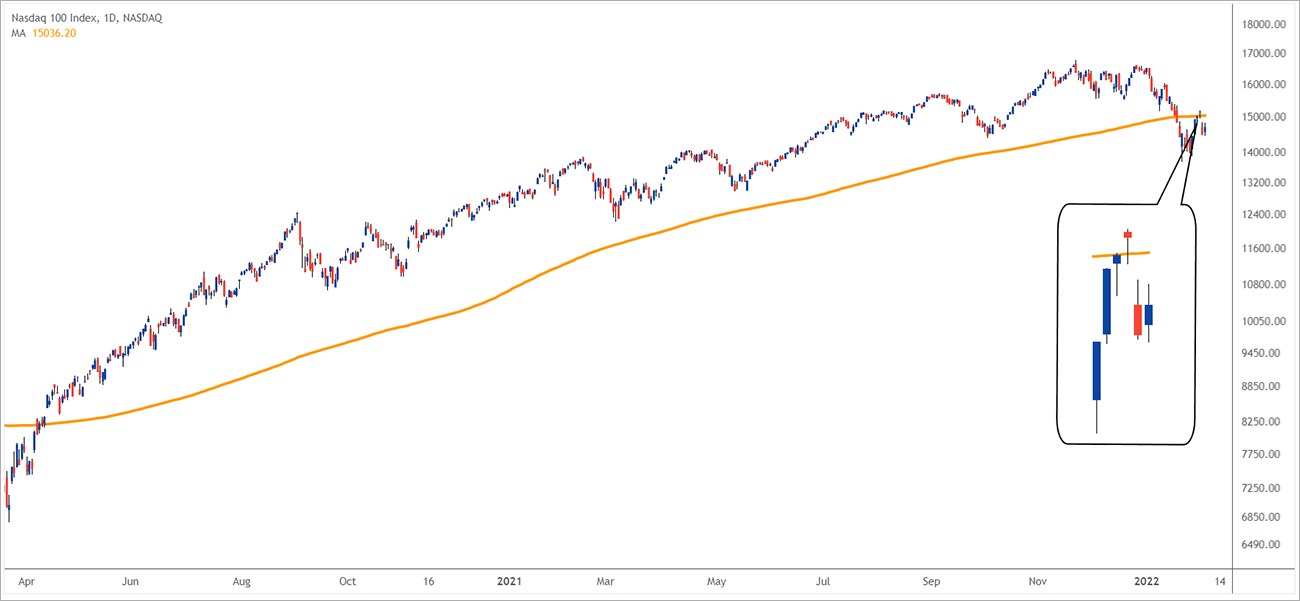
If I look at the daily chart of the NASDAQ, it has gone below its 200-days average and is very, very problematic for me because an index falling below this, generally the 200-days average is known as the long-term average. When the price goes below the 200-days average, the long-term trend tends to reverse and that's what happened in the NASDAQ.
The momentum has gone below. It tried to come up above the 200-days average but if you look at the box which has been marked, it is generally the evening star candle stick pattern. The evening star candle stick pattern is a three candle pattern indicating that it is a bearish sign. We saw this structure happening.
So still I think till 15,500 level is not breached on the NASDAQ, I think the momentum could continue on the bearish side. So this is very, very, crucial. This this level is not crossed, I think momentum would continue on the bearish side.
The recent lows in case it is broken down, the momentum could be very fast and furious on the downside.
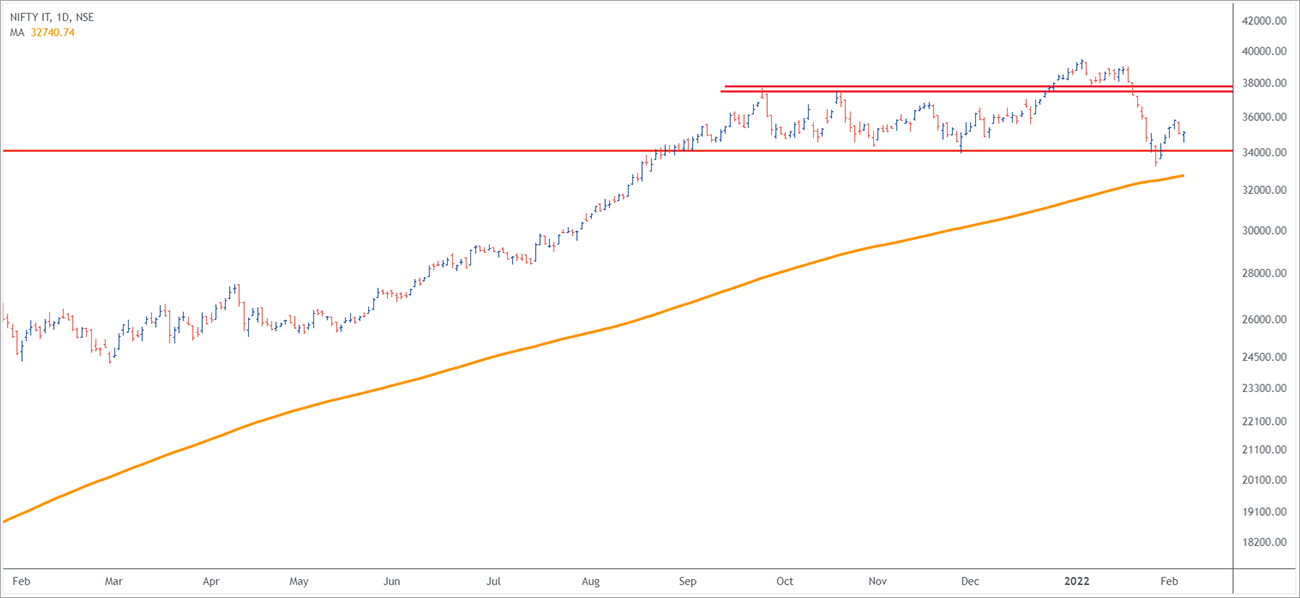
If I look at the IT index chart, still something is there for the bulls. I would not say that it has 100% turned bearish.
Two things over here. Look at the lower red line. The upper red lines are the breakout levels and the break out has failed. Now we are below the lower red line and there was a recovery.
Second indication is that we are above the 200-days average on the daily chart of the CNX IT and now, in case that level is broken down, I think it will be the end for the 2022 for the IT space.
So it is trending at the part of the bridge where one side, if it tries to turn out above the recent highs of 36,000-36,300 levels, that will be a signal that the bearish momentum has ended. But in case we slip below the 32,000-33,000 mark, I think it might be the end for the IT index in 2022 and one should definitely avoid it then.
Again, NASDAQ would be the very, very crucial indication. If the recent lows are broken, the IT index could be following the footsteps of the NASDAQ and fall. So I think there is a make or break level for the CNX IT Syrians at current point of time. I think I will definitely avoid this sector in 2022 at least and look at the momentum in some other sectors. They are coming back very strongly. Especially the midcaps.
So I think IT is at a make or break level. I'm definitely keeping a watch. In case the 200-days average is broken down and NASDAQ follows the bearish continuation momentum, I think that could be the end for the IT space. So definitely look for these levels into the IT space and the NASDAQ.
Signing off, Brijesh Bhatia.
Warm regards,

Brijesh Bhatia
Research Analyst, Fast Profit Report
Equitymaster Agora Research Private Limited (Research Analyst)
Recent Articles
- Pyramiding PSU Bank Stocks September 22, 2023
- How to trade PSU banking stocks now.
- 5 Smallcap Stocks to Add to Your Watchlist Right Now September 12, 2023
- These smallcaps are looking good on the charts. Track them closely.
- Vodafone Idea - Can Idea Change Your Life? September 6, 2023
- What is the right way to trade Vodafone Idea?
- Repro Books Ltd: The Next Multibagger Penny Stock? August 28, 2023
- Is this the next big multibagger penny stock? Find out...
ABOUT EQUITYMASTER
Since 1996, Equitymaster has been the source for honest and credible opinions on investing in India. With solid research and in-depth analysis Equitymaster is dedicated towards making its readers- smarter, more confident and richer every day. Here's why hundreds of thousands of readers spread across more than 70 countries Trust Equitymaster.
PREMIUM PRODUCTS
QUICK LINKS
POPULAR TOPICS
- Multibagger Penny Stocks
- Basics of Value Investing
- Benjamin Graham
- How to Invest in Gold
- How to Invest in Silver
- Best Stocks to Buy Today
- Best Small-cap Stocks to Buy
- Best Bluechip Stocks to Buy
- Guide to Penny Stocks
- How to Invest in the Share Market
- Warren Buffett - The Value Investor
- Pick the Best Multibagger Stocks
TRENDING TOPICS
 Donate to credible NGOs in the sector of your choice (ii) Claim 50% tax benefit u/s 80G (iii) Receive periodic reports.")
Copyright © Equitymaster Agora Research Private Limited.
Whitelist | Refer | Terms | Privacy | Contact | About | Sitemap
Equitymaster Agora Research Private Limited (Research Analyst)
SEBI (Research Analysts) Regulations 2014, Registration No. INH000000537.
103, Regent Chambers, Above Status Restaurant, Nariman Point, Mumbai - 400 021. India.
Telephone: +91-22-61434055. Email: info@equitymaster.com. Website: www.equitymaster.com.
CIN:U74999MH2007PTC175407
Name of the Compliance & Grievance Officer: Ms Sonal Ramachandran
Telephone: +91-22-61434003 | Email: compliance@equitymaster.com
LEGAL DISCLAIMER:
Investment in securities market are subject to market risks. Read all the related documents carefully before investing.
Registration granted by SEBI and certification from NISM in no way guarantee performance of the intermediary or provide any assurance of returns to investors.
All rights reserved. Any act of copying, reproducing or distributing this newsletter whether wholly or in part, for any purpose without the permission of Equitymaster is strictly prohibited and shall be deemed to be copyright infringement.
Equitymaster Agora Research Private Limited (Research Analyst) bearing Registration No. INH000000537 (hereinafter referred as 'Equitymaster') is an independent equity research Company. Equitymaster is not an Investment Adviser. Information herein should be regarded as a resource only and should be used at one's own risk. This is not an offer to sell or solicitation to buy any securities and Equitymaster will not be liable for any losses incurred or investment(s) made or decisions taken/or not taken based on the information provided herein. Information contained herein does not constitute investment advice or a personal recommendation or take into account the particular investment objectives, financial situations, or needs of individual subscribers. Before acting on any recommendation, subscribers should consider whether it is suitable for their particular circumstances and, if necessary, seek an independent professional advice. This is not directed for access or use by anyone in a country, especially, USA, Canada or the European Union countries, where such use or access is unlawful or which may subject Equitymaster or its affiliates to any registration or licensing requirement. All content and information is provided on an 'As Is' basis by Equitymaster. Information herein is believed to be reliable but Equitymaster does not warrant its completeness or accuracy and expressly disclaims all warranties and conditions of any kind, whether express or implied. Equitymaster may hold shares in the company/ies discussed herein. As a condition to accessing Equitymaster content and website, you agree to our Terms and Conditions of Use, available here. The performance data quoted represents past performance and does not guarantee future results.
Equitymaster requests your view! Post a comment on "Is this the Beginning of the End for IT Stocks?". Click here!
Comments are moderated by Equitymaster, in accordance with the Terms of Use, and may not appear
on this article until they have been reviewed and deemed appropriate for posting.
In the meantime, you may want to share this article with your friends!