
This is When the Markets Will Bounce Back

Many of you must be wondering when the current bearish phase of in the market will end.
When will the sun shine on the bulls again?
In this video, I'll show you three charts that will help you predict the market's recovery.
Watch the video and let me know what you think. I love to hear from you.
Hello friends. This is Vijay Bhambwani. I've been trading these markets since 1986 and I had the pleasure and privilege of learning in the markets on the fly, through trial and error, with real time trades.
Many of you must be wondering as to when the current phase of bearishness in the market will terminate, and the sun will start to shine again on the bulls all over again.
In this video, I want to help you with three do it yourself or DIY indicators that you can plot at home, either on a chart paper with a piece of paper and pencil or, if you're savvy enough, you can do it digitally in Microsoft Word, Microsoft Excel, or even online in many websites.
So let's plunge right in and the first chart that you're seeing on your screen is the advance decline ratio.
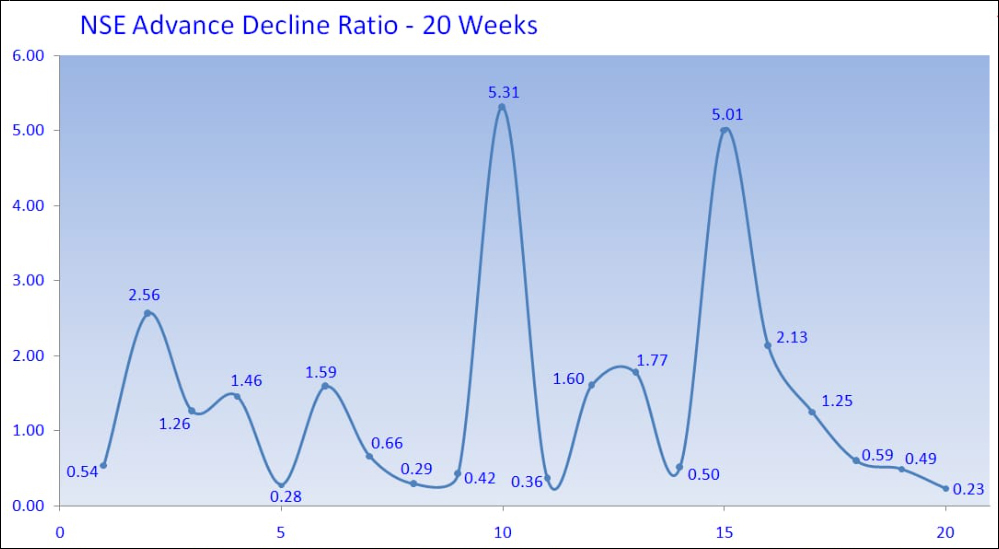
No rocket science here. As the very name suggests, this is the ratio of the number of shares advancing versus the number of shares falling.
Why am I looking at that and why should you care? Because this is a gauge, or a measure of the risk appetite of one marshmallow traders.
Don't Miss: Best Chance to Access Midcap Stocks Research at 80% OFF
Who are one marshmallow traders? These are traders who basically square up their positions intraday and they do not roll over their positions, long or short, to the next day.
Now, as you can see on that chart, the advance decline ratio has been falling sustainably, and it is sticking below zero for many weeks now. This is a weekly chart. That means that week after week, the bulls are simply buying far less than the bears are selling, which is why the market is falling.
The first indicator that the bulls are now returning should be when the advance decline ratio turns positive for at least three consecutive trading sessions.
That will be your first alarm bell indicator, warning, cue, call it what you want, but you should monitor this.
Where do you get this data? Very simple. You should get it on your broker's trading terminal on the website of your broker's official website, and definitely on the National Stock Exchange's website itself. So do monitor this. You can plot this, like I said, either by hand on a piece of paper or digitally using Excel or any other tool.
The second indicator that I want you to watch is the basis. Now what is the basis? Don't get intimidated. This complicating sounding word is nothing but the premium enjoyed by the future over spot.
Why do you look at it? Because it is a measure of the risk appetite of two Marshmallow traders. Who are two marshmallow traders? Now these are guys who roll over there long positions or short positions to the next trading session.
They have a higher risk appetite. They have deeper pockets. They pay mark to market money. They pay span margins, to dig their heels into the ground, into the trade, and stay put. So the indications of the two marshmallow guys are stronger than the indications of the one marshmallow guys.
Now what is the basis? The basis, like I told you, is the premium enjoyed by future over cash. And if you ever traded options, you will realise that options premia tends to be the biggest at the beginning of the derivative cycle, and as time passes, it starts to compress or it is called time decay.
So also, the futures premium erodes with time, but hypothetically speaking, at the beginning of a derivative cycle, the futures premium should be extremely high, and then it should start to compress day after day, week after week.
But look at the weekly chart of the basis of the Nifty and the Bank Nifty.
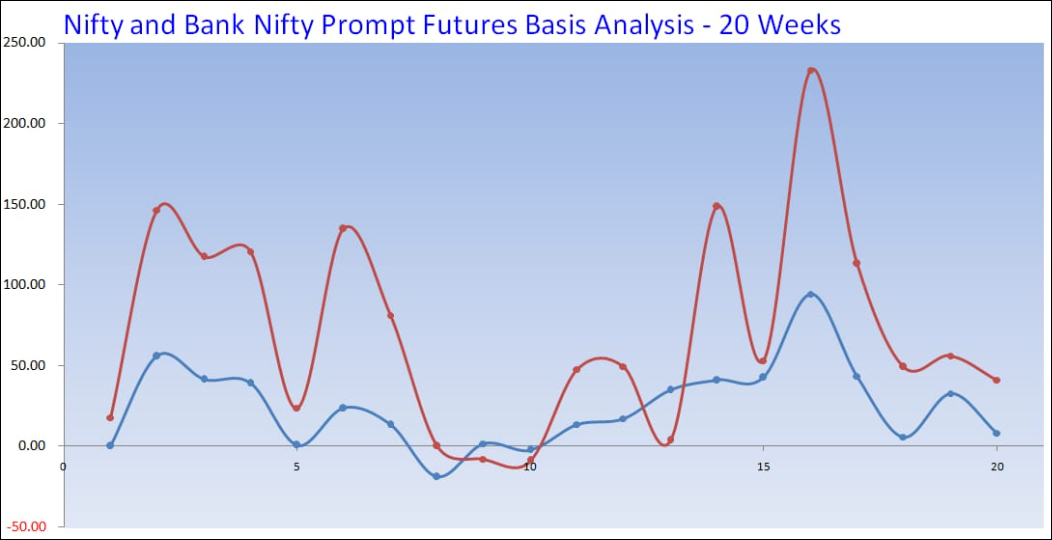
You will see that gone are the days when the hefty basis that we used to see in October, November, and December. They are history now.
So the basis has actually been falling and many a times intraday, I see the basis of the Nifty go into negative which means the future is actually trading at a discount to cash.
So that tells you that there is higher risk appetite among the bears to short self but very little risk appetite amongst the bulls to buy, which explains the very small amount of basis enjoyed by the indices at the beginning of the derivative cycle.
Also, can you use the basis on individual stocks? Yes, definitely. Any stock that is in the F&O space, you can use the basis. It's basically the futures price minus the spot price, at that prevailing time.
The third and final indicator that I want you to do yourself is the MWPL. The MWPL stands for market wide position limits.
Now, what is market wide position limits? And why should you care? I want to help my viewers not just to use these indicators, but also understand why they are using these indicators, so that they have better confidence in their own work.
Now the MWPL is nothing but the amount of derivative exposure utilised by the entire market as compared to the total net exposure allowed by SEBI and in the stock exchange.
So if you're allowed to take one crore lots in futures and options, but the traders have utilised only 50 lakhs lots, the MWPL stands at 50. That is a very simple explanation of what is happening out there.
Unfortunately, the financial market industry specialises in jargonising and using a lot of technicalaese which confuses a retail investor. These are just complex sounding words. Don't get intimidated. It's all very simple, and I can help you in my videos to basically unravel the jargon and get you the real message behind that.
So now the MWPL, the higher it is, the higher is the risk appetite because traders are saying, okay, we have limits to buy. Let's buy up to that limit.
Can MWPL go of to 100%? Hey, that's not possible at all before some stop will be 3% some will be 30, some will be 80. Some will be 90. So the entire market's average MWPL can never be 100.
But can individual stocks be 100? The answer is yes. Traders can get ecstatic. Traders can get sad. They can get bearish on it. So they can buy a beyond limits and they can short beyond limits too. So individual stock MWPL can go to 100.
Can it remain zero? No, it cannot remain zero. The only way MWPL can go to zero is if the stock is not traded at all. If it is not traded if it is illiquid, believe me, every six months there is a review of stocks that are existing in the F&O list, and it would get chucked out for no volume or lack of volume as a percentage of its free float.
So MWPL cannot be zero. For individual stocks, it can go to 100 but overall market, it cannot go to 100. Now the weekly chart of MWPL on your screen.
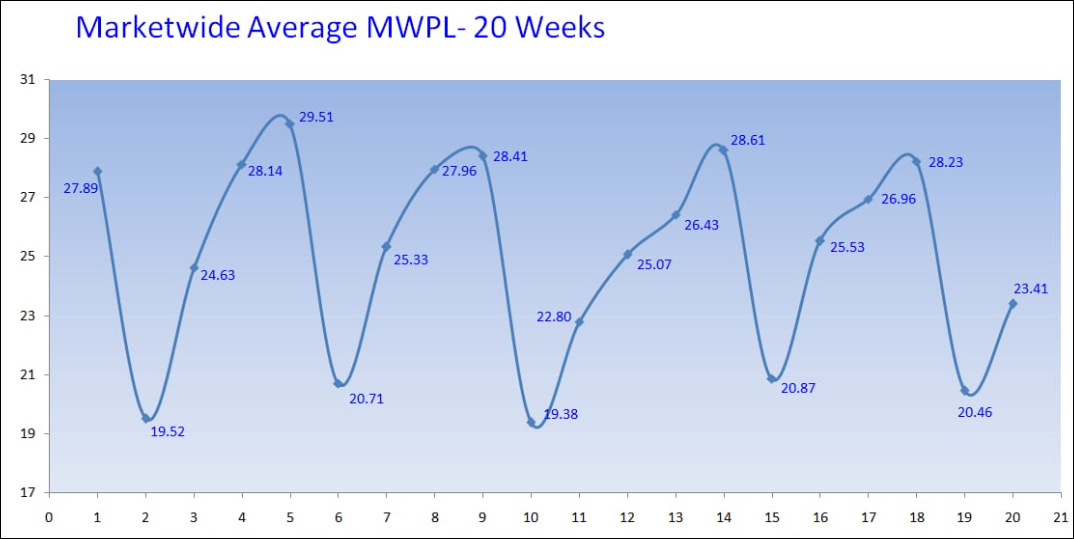
You see up to October-November, I used to see MWPL peaking out at 32-34%. But after December, I have noticed that the MWPL is peaking out between 28-29%. So risk appetite has actually shrunk by 10% after December. Are you surprised that the markets are showing you signs of sluggishness? There is no risk appetite.
Now what is the MWPL indicating? It is indicating the risk appetite of two marshmallow traders. These are trainers who initiate a position and carry it over to the next day which is why the MWPL changes on a day to day basis.
When do you get this data? Ideally speaking, you should get it from your broker's terminal or your mobile phone on the fly in the F&O space. But if not, then definitely from the NSE website.
So when will the market shows signs of bottoming out?
When the MWPL across the board starts to rise. When do you think you will say that the MWPL has actually started to rise? I think it would take a minimum of 30-32% of MWPL to be arrived and sustained over a couple of days before I can say that the sun is shining on the bulls all over again.
So do remember my friends, these are leading indicators which will tell you way ahead of what the media, what social media, what the chatter of traders in online chat groups, etcetera will tell you because this is market trading action in real time. This tells you on the fly that the market has turned.
This is where you should keep your ears to the ground to take signals of the market as it trades.
I hope this video helps you become far better traders and you can make a lot of money both in individual stocks and the indices, Nifty and the Bank Nifty. All these three studies can be used like I said manually with the piece of paper and pencil and digitally and on individual stocks in the F&O space as well as in indices.
So this is a very, very healthy and profitable set of tools. Depending on how the feedback to this video is, I am open to the idea of sharing many more such ideas with my viewers.
On this promising note, I bid goodbye to you not before reminding you to click like in this video if you liked what you saw.
Subscribe to my YouTube channel if you haven't already done so. Good, bad or ugly, I welcome your feedback in the comments space. Also, please help fellow like-minded investors and traders by sharing this video with your family and friends.
I thank you for your patience and watching this video with me, and I wish you have a very, very profitable day ahead. Take care. Bye.
Warm regards,
![]()
Vijay L Bhambwani
Editor, Fast Profits Daily
Equitymaster Agora Research Private Limited (Research Analyst)
Recent Articles
- Pyramiding PSU Bank Stocks September 22, 2023
- How to trade PSU banking stocks now.
- 5 Smallcap Stocks to Add to Your Watchlist Right Now September 12, 2023
- These smallcaps are looking good on the charts. Track them closely.
- Vodafone Idea - Can Idea Change Your Life? September 6, 2023
- What is the right way to trade Vodafone Idea?
- Repro Books Ltd: The Next Multibagger Penny Stock? August 28, 2023
- Is this the next big multibagger penny stock? Find out...
ABOUT EQUITYMASTER
Since 1996, Equitymaster has been the source for honest and credible opinions on investing in India. With solid research and in-depth analysis Equitymaster is dedicated towards making its readers- smarter, more confident and richer every day. Here's why hundreds of thousands of readers spread across more than 70 countries Trust Equitymaster.
PREMIUM PRODUCTS
QUICK LINKS
POPULAR TOPICS
- Multibagger Penny Stocks
- Basics of Value Investing
- Benjamin Graham
- How to Invest in Gold
- How to Invest in Silver
- Best Stocks to Buy Today
- Best Small-cap Stocks to Buy
- Best Bluechip Stocks to Buy
- Guide to Penny Stocks
- How to Invest in the Share Market
- Warren Buffett - The Value Investor
- Pick the Best Multibagger Stocks
TRENDING TOPICS
 Donate to credible NGOs in the sector of your choice (ii) Claim 50% tax benefit u/s 80G (iii) Receive periodic reports.")
Copyright © Equitymaster Agora Research Private Limited.
Whitelist | Refer | Terms | Privacy | Contact | About | Sitemap
Equitymaster Agora Research Private Limited (Research Analyst)
SEBI (Research Analysts) Regulations 2014, Registration No. INH000000537.
103, Regent Chambers, Above Status Restaurant, Nariman Point, Mumbai - 400 021. India.
Telephone: +91-22-61434055. Email: info@equitymaster.com. Website: www.equitymaster.com.
CIN:U74999MH2007PTC175407
Name of the Compliance & Grievance Officer: Ms Sonal Ramachandran
Telephone: +91-22-61434003 | Email: compliance@equitymaster.com
LEGAL DISCLAIMER:
Investment in securities market are subject to market risks. Read all the related documents carefully before investing.
Registration granted by SEBI and certification from NISM in no way guarantee performance of the intermediary or provide any assurance of returns to investors.
All rights reserved. Any act of copying, reproducing or distributing this newsletter whether wholly or in part, for any purpose without the permission of Equitymaster is strictly prohibited and shall be deemed to be copyright infringement.
Equitymaster Agora Research Private Limited (Research Analyst) bearing Registration No. INH000000537 (hereinafter referred as 'Equitymaster') is an independent equity research Company. Equitymaster is not an Investment Adviser. Information herein should be regarded as a resource only and should be used at one's own risk. This is not an offer to sell or solicitation to buy any securities and Equitymaster will not be liable for any losses incurred or investment(s) made or decisions taken/or not taken based on the information provided herein. Information contained herein does not constitute investment advice or a personal recommendation or take into account the particular investment objectives, financial situations, or needs of individual subscribers. Before acting on any recommendation, subscribers should consider whether it is suitable for their particular circumstances and, if necessary, seek an independent professional advice. This is not directed for access or use by anyone in a country, especially, USA, Canada or the European Union countries, where such use or access is unlawful or which may subject Equitymaster or its affiliates to any registration or licensing requirement. All content and information is provided on an 'As Is' basis by Equitymaster. Information herein is believed to be reliable but Equitymaster does not warrant its completeness or accuracy and expressly disclaims all warranties and conditions of any kind, whether express or implied. Equitymaster may hold shares in the company/ies discussed herein. As a condition to accessing Equitymaster content and website, you agree to our Terms and Conditions of Use, available here. The performance data quoted represents past performance and does not guarantee future results.
Equitymaster requests your view! Post a comment on "This is When the Markets Will Bounce Back". Click here!
Comments are moderated by Equitymaster, in accordance with the Terms of Use, and may not appear
on this article until they have been reviewed and deemed appropriate for posting.
In the meantime, you may want to share this article with your friends!