Should You Buy Asian Paints with Crude Oil @ US$100

Crude oil prices have remained high above US$ 100.
This has increased input prices for paint companies.
The leader, Asian Paints, has taken a hit and its share price is down.
But is it a buy at these levels?
Find out in this video...
Hello viewers. Welcome to the Fast Profits Daily. Myself Brijesh Bhatia.
Since 2020 pandemic lows most of the asset classes have been recovering and we have seen a V-shaped recovery in commodities, equities and off late the bond more market have seen a huge upside.
With the Russia-Ukraine war, crude oil prices have been consistently trading in the 3-digit zone, which means that it's been convincingly trading above the US$ 100 mark.
We have seen commodities, one of the leading asset classes, even in 2020-2021, where metals have seen upside, in 2022 crude oil prices are trending very, very bullish. Even we saw in 2020 gold prices trending higher and higher. Agri commodities in off late have been trading very, very high be it sugar and some of the soft commodities.
But in this video, we will be discussing about the crude oil price, which is trending above the US$ 100 mark, which is the 3-digit mark. What is the impact on to the equity market and should you buy the crude impacted stocks?
Don't Miss: Best Chance to Access Midcap Stocks Research at 80% OFF
Well when crude is trending higher, there are various sectors which affect the prices of the sectors and one such sector is the paints sector and Asian Paints, one of the leading stock in the sector, seems very, very affected with the crude oil prices. Now as crude is trading above the US$ 100 mark, should you buy Asian Paints?
Well, when the crude oil prices go higher, raw material prices go higher for Asian Paints, and they pass on the prices to the customers. But in this video, I'm not coming over the fundamental factors which could be a positive or negative for Asian Paints. But I'll be speaking about some of the technical aspects. Why I think Asian Paints, should you buy it, or shouldn't you buy it.
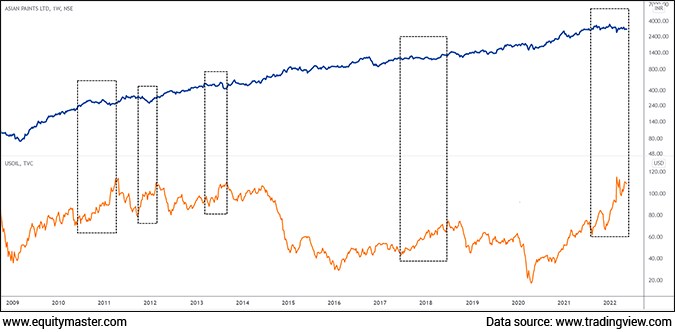
Let's look at the first chart over here where I have compared the Asian Paints trending move with the crude oil prices.

Now, if we look at the price chart, below the orange one, which is the crude oil prices and above is the blue colour which is the Asian Paint stock price action.
Now when the crude oil prices go higher, Asian Paints consolidates during those times. Similarly right from 2010 we have seen when crude oil prices went higher, Asian Paints consolidated. In 2013, crude oil prices went higher, and Asian Paints consolidated.
I'm not looking at a 2%-3% move on crude oil prices. I'm looking at minimum of 10% of price action. So when the crude oil prices go more than 10% higher, I'm considering the Asian Paints movement.
Now look at 2018, where we crude oil prices trending higher from the lows of 2016. When the momentum picked up Asian Paints consolidated in the similar range for quite long.
2022 or since the end of 2021, if you look at the momentum crude oil prices have been trending very much higher. Now again, we saw US$ 110-112 in crude oil prices. But look at Asian Paints. It has been consolidating.
Should you buy? Or should you avoid Asian Paints now? Let's look at the second chart here.

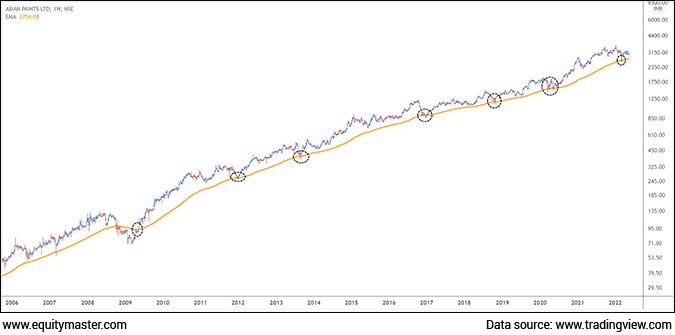
This is a weekly chart of Asian Paints. The orange line which you see on your screen, is the 100 weekly moving average exponential moving average.
Now, when the prices test, 100 weekly exponential moving average, they tend to take support, and this is not the one time, twice or thrice but if you look right from 2009, after the fall, we saw Asian Paints coming back above the 100 weekly exponential moving average.
Back in 2013, it tested and went higher. Back in 2016-17 it tested and went higher. Back in 2018, it tested and went higher. In 2020 when the pandemic fall happened, it tested around those levels and went higher.
Back in 2022, it again tested the 100 weekly exponential moving average and it is again heading higher.
Now this is very, very important because when a trend is set, they generally tend to take support, and every stock has his own nature of trending. Be it bullish. Be it bearish. Asian Paints has been trending of the 100 weekly exponential moving average. They tend to play an excellent risk-reward entries for investors those who are looking for a long-term momentum in Asian Paints.

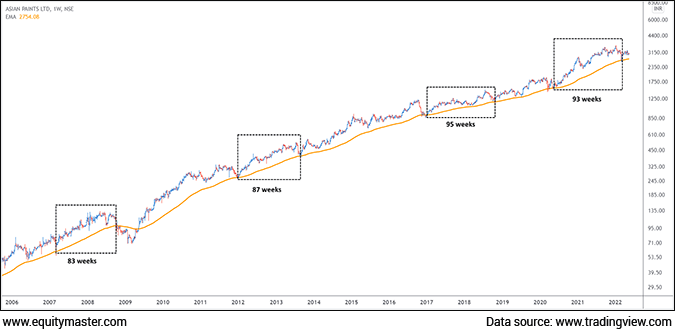
Now, look at the same chart, he 100 weekly exponential moving average but with the time cycle.
Now when it tests, it generally tests back the 100 weekly exponential moving average after around 80-95 weeks.
Now back in 2007 when it went higher, it tested back into the 83 weeks. In 2011, it tested, after moving higher from testing, it came back to test after 87 weeks. Back in 2016, it tested, went higher, tested after 95 weeks, which is, if you look at the 95 weeks, it is nearly 19-20 months.
In 2020 where during the pandemic, it tested 100 weekly exponential moving average and then it tested back after 93 weeks.
Now this cycle is repeating, though there could be plus or minus, a few weeks here and there, but if you look right from 85 weeks to 95 weeks, this is a very, very similar phenomenon which is happening in Asian Paints.
Now back in 2021-22 when it tested 100 weekly exponential moving average, it is showing a sign of positive momentum, which means that there could be a possibility that it may head higher for next 1-1.5 year in the bullish scenario and then it might test and at the same point if you look at the average, the slope is also going higher and higher, which means that when it comes to test, the form, the structure, is very much a higher high-higher low structure which is bullish as per the Dow Theory.

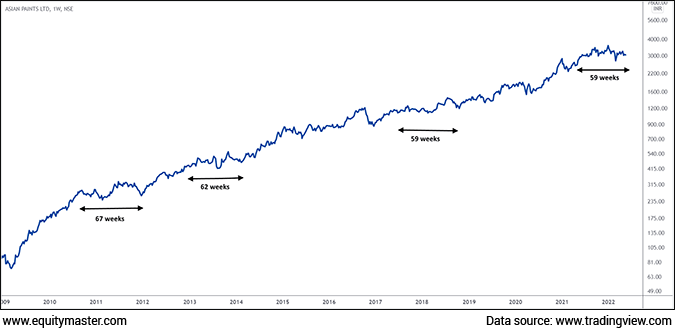
Now the second time cycle which I want to highlight over here is look at the chart here on your screen.
When the consolidation happened, the first chart which I showed you with Asian Paints and crude oil, when this consolidation happened, it tends to be around 62-67 weeks. The first consolidation was right at 67 weeks. Second consolidation was in 62 weeks. The third was 59 weeks, and the recent one, again if I consider that 59 which was the lowest, we are in 57 weeks now.
Again probably if I look at another 4-5 weeks, we might see a huge momentum starting again in Asian Paints on the bullish side.
If you remember 62 is the Fibonacci number. 61.8 is generally known as the golden ratio. And considering the few plus or minus, a couple of weeks here and there, this tends to be a very, very exciting opportunity in Asian Paints where, as an investor, I think probably there could be a slow accumulation happening for next 4-5 probably 6 weeks, and stock might see again an upside.
Again as an investor do keep in mind that Asian Paints has generally never disheartened investors for the bullish momentum. So as an investor, I think for next 4 to 6 weeks, one should accumulate this stock in a staggered manner and probably we might see upside happening into the Asian Paints.
As we have seen, the 100 weekly exponential moving average played a key, important role. The time cycle theory indicates that the momentum can be on cards for an investor. Possibly for the next 1.5 to 2 years. We might see this stocks heading higher and higher.
Signing off, Brijesh Bhatia.
Warm regards,

Brijesh Bhatia
Research Analyst, Fast Profit Report
Equitymaster Agora Research Private Limited (Research Analyst)
Recent Articles
- Pyramiding PSU Bank Stocks September 22, 2023
- How to trade PSU banking stocks now.
- 5 Smallcap Stocks to Add to Your Watchlist Right Now September 12, 2023
- These smallcaps are looking good on the charts. Track them closely.
- Vodafone Idea - Can Idea Change Your Life? September 6, 2023
- What is the right way to trade Vodafone Idea?
- Repro Books Ltd: The Next Multibagger Penny Stock? August 28, 2023
- Is this the next big multibagger penny stock? Find out...


Equitymaster requests your view! Post a comment on "Should You Buy Asian Paints with Crude Oil @ US$100". Click here!
Comments are moderated by Equitymaster, in accordance with the Terms of Use, and may not appear
on this article until they have been reviewed and deemed appropriate for posting.
In the meantime, you may want to share this article with your friends!