Push the Pedal Down on Auto Stocks

The auto sector has been an underperformer for a long time. The sector faces many issues that are well known.
But what do the charts say? Is there a reversal on the cards? Are these stocks becoming good investments now?
Find the answers in this video.
Hello viewers. Welcome to the Fast Profits Daily. Myself Brijesh Bhatia.
Markets have been trending in a range and taking supports right at the lower level of 15,700 and it has been swinging between 15,800 on the downside and 16,300-16,400 on the upside.
I have recorded a video and indicated that 16,450-16,600 will be a crucial resistant zone, and markets might swing into those zones before taking out the trending move. But between that swing, there are a few sectors which are coming back very, very strongly. There are a few stocks which are coming back very, very strongly and heading with the bullish momentum. One such sector is auto space.
Don't Miss: Best Chance to Access Midcap Stocks Research at 80% OFF
You might be thinking that why am I indicating the auto space over here because crude is trading above US$ 100-110 mark, which is very, very negative, and it might continue to put pressure on the auto space.
Yes, you are right. Let's look at the first chart comparing with the US oil is crude oil in the dollar terms against the auto space.

So if you look at the chart over here, this is the auto index above, which is the blue line. If you look at the lower panel, it's the US crude oil spot chart. Now, if you look at the momentum, yes they are inverse in relationship. Which means that when the crude oil prices go higher, it puts pressure on the auto index.
But the thing which I want to indicate over here, let's start with the historical move. What happened in 2008? All the markets corrected. Even equity index corrected. Commodities corrected. We had a recession.
Since then, when we saw 2008-2009 recovery towards 2010 probably mid of 2010, all the asset classes have seen a huge uptick, be it equity or commodities and yes, auto index has in the Indian indices witnessed a V-shaped recovery. Oil was also coming back from the lower levels and coming higher.
But if you look at 2011, which is most important, between 2011 to around 2014, look at the crude oil prices. It went into the consolidation zone and at the same time, if you look at the auto index, it went higher and higher, indicating that after a rally in the crude oil, when crude oil goes into the consolidation zone, it is a time when auto index starts to outperform.
The auto index, it was between 20112-2014, one of the most outperforming sectoral indices, which even took an index like Nifty higher comparing with the other benchmark indices.
Now, right from between 2014 to 2016, crude oil prices went lower and auto index continued to outperform. Between 2014-15, it consolidated. Back in 2015-16 it rallied and went to the new all-time high. But since then, I guess auto was majorly in a downtrend to the profit booking and crude oil also traded in a range.
But in 2020, we saw a pandemic fall. There was a lockdown. Crude oil prices also went into the negative in the futures. Auto index and most of the equity index corrected. We saw a V-shaped recovery in all the asset classes. Be it commodity, equity, there was a V-shaped recovery into the auto space as well, and crude oil prices as well.
But if you look at 2021 when crude oil prices started heading higher and higher, right from around, I would say it consolidated around US$ 45-50 but when it crossed US$ 55-60 mark, it headed towards US$ 100. Auto index was underperforming and by a huge margin it was consolidating in a range. But now I believe that the worst is over for inverse relationship.
The crude oil prices are now comfortably trending US$ 100-110 mark. We are not seeing the bullish momentum continue. But at the same time, I believe that if the crude oil prices, like we saw in 2011-2014, if it goes into consideration, probably we might head towards US$ 120-122 mark, then back to US$ 80-85.
And at that point of time, I think auto index would be one sectoral index where you should push the pedal into an investment avenue. This is not the parameter which I am only looking at, the crude oil basket, particularly when you look at the auto index chart. Lt me show you the auto index chart over here.

Now, if you look at the auto index chart, if you look at the Nifty, if you look at the midcap index, if you look at the smallcap index, if you look at the CNX 500 which is the broader index, all of them have given a negative crossover, which means a death cross, which means that the 50 days exponential moving average or simple moving average, whatever you are following, goes below the long term average. The short term average goes below the long term average which is the 200 period.
Now, if I look at 200 period, the exponential one in the auto space, that has not happened. So there is no death cross yet in the auto index. I would not say that the golden cross is very, very bullish over here, but prices of the index is consolidating around the 250 exponential moving average. Both the averages are converging at the current point of time but there is no death cross. This means the structure is not yet bearish. Plus if I look at the momentum, it's still very, very bullish.
If I look at the one chart which is more convincingly which is in line with crude oil, it is the auto index divided by Nifty. Here I am using the ratio chart.

So if you look at his third chart, this is the ratio chart of auto index divided by Nifty.
Why have I taken this because it helps to compare the outperformance of auto index against the Nifty 50 which is a benchmark index.
Now most importantly, if you look at the structure over here, Nifty right from 18,600, we were back toward 16,000 levels now, and if we look at the same time the auto index has been outperforming.
It is nor breaching the downward range over here and if we look at the recent chart over here, we have broken out of the multiple resistance zones.
Plus, look at the bullish crossover on the MACD, which is in the lower panel. So MACD is basically the momentum indicator, which helps you to identify the bullish momentum or bearish momentum. Now the positive crossover means that the short term average taken over the long term average, which is very, very bullish for the MACD as well.
Plus, if you look at the green histogram over here, which is trading above the zero line, again it is indicating that the bulls are still in control of the momentum right now.
So with the outperformance of auto index against the Nifty, it indicates that the structure is very, very bullish for auto space over here.
| Constituents | Weightage |
|---|---|
| Maruti | 25.51% |
| M&M | 14.74% |
| Bajaj Auto | 10.74% |
| HeroMotoco | 8.91% |
| Tata Motors | 8.08% |
| Eicher Mot | 7.96% |
| Mothersumi | 3.75% |
| MRF | 3.47% |
| Bosch | 3.32% |
| Ashok Leyland | 3.05% |
| Bharat Forge | 3.32% |
| TVS Motors | 2.49% |
| Exide | 2.23% |
| Amaraja Batt | 1.54% |
| Apollo Tyre | 1.44% |
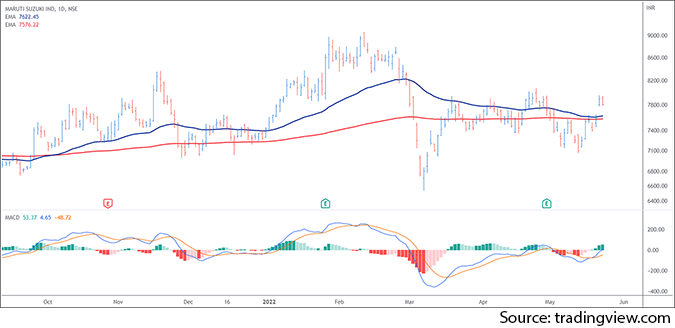
Now, if you look at the constituents of the auto index, Maruti leads the index over here with 25% weightage, followed by M&M, which holds around 15% weightage, Bajaj Auto, with around 10.74% weightage, Hero Moto with around 9% weightage, Tata Motors with 8% weightage, and the list continues on your screen over here.
Let deep dive into some of these stocks and look at what the chart structures are indicating on these stocks. Do they really mean that the auto index could head higher because once these stocks starts moving, auto index will automatically start going up. But if they are struggling to head higher auto index will not outperform.

Let's look at the first one, which is the leader, Maruti. Now, if you look at the Maruti, prices are hovering around 50 and 200 days exponential moving average. Again the bullish MACD, which is on the lower panel on your screen, is indicating that the structure is very, very bullish. As said the positive crossover means that the structure is very bullish.
Maruti at 8,200 might act as a resistance which was the previous highs. But look at the recent momentum. It is forming a higher high, higher low structure. And when markets are trending in a range for last one week, the Maruti stock is gaining a strong upside momentum. So which again strengthens the auto index view where the momentum is very, very bullish.
If I look at the recent structure, it is forming a higher high, higher low structure, a bullish structure is in place as for the Dow Theory. So Maruti, a 25% weightage stock is indicating the bulls are in control of the stock.

Second, if I look over here is the M&M, which holds around 15% weightage. Look at the structure. It has given a massive range breakout, and it is one of the most outperforming auto stock if I compare it with the auto index or even with the Nifty.
This stock is gaining a strong momentum and it has broken the multiple resistances. If you look at the previous highs over there, the price has broken the multiple resistance zones. Plus the bullish crossover on the MACD. Plus, the histogram is indicating the structure is very, very bullish.

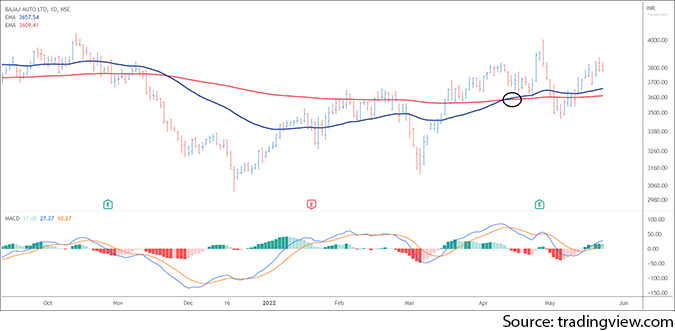
If I look at the Bajaj Auto, which holds around 11% weightage, 10.74% to be precise, golden cross after the death cross, MACD is positive, and the histogram is trending positive.

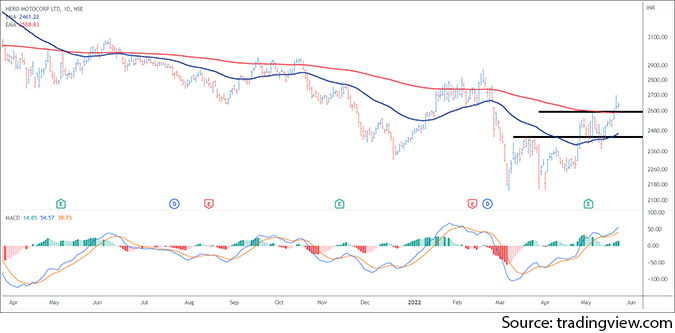
The next one is Hero Moto. This is the one chart in this space where there is a death cross, which means that the short term average is below the long term average.
But if you look at the price in the recent times, it has come back very, very strongly and the price is now trending about the long term average. Above the long term average means that it is breaking the resistance zone which is 200 exponential moving average if you look at the orange line over there.
Plus multiple resistances have been taken out. The breakout from a multiple resistances means that highs are taken out, and the bulls are coming back very, very strongly. Again the MACD, a positive crossover over there.

Tata Motors, again a bullish structure over here, though it has been hovering between 50 and 200 days exponential moving average. But if I look at the structure over there, the price action is resisting around the 200. Once 430-450 is taken out, I think the momentum will be very fast and furious in Tata Motors as well.

Ashok Leyland, again multiple resistance break out, bullish cross over on the MACD, and again look at the consolidation zone and the range breakout happening, which is very, very bullish considering structure.
Look at the heavy vehicles like Tata Motors and Ashok Leyland, the product which they have. They're coming back very, very strongly. So yes, commercial space, passenger vehicles, two-wheeler space, heavy vehicles, all are indicating the bullish structure is in place.

TVS Motors, two-wheeler space. Look at the TVS Motors over here. It's coming back very, very strongly. Breakout is from the multiple resistance zone. MACD giving a positive cross over again indicates that the structure is well placed for auto index.
So looking at this stocks, where most of the weightage has been covered, I believe that auto space is at a right time to push the pedal, and we might see these stocks or the index heading very much higher in the coming weeks.
Again, I'm not looking for probably of week or two weeks of trade, but I'm looking from a second half of the 2022, where auto index could be one of the outperforming indices.
As we are stepping into the June, this is the last month of the first quarter. I think this is right time to enter into the auto space and probably we might see the second half very bright for the auto space, be it commercial, passenger, two-wheelers, heavy vehicles, all the charts are indicating that something is very, very bullish on the auto space.
Signing off, Brijesh Bhatia.
Warm regards,

Brijesh Bhatia
Research Analyst, Fast Profit Report
Equitymaster Agora Research Private Limited (Research Analyst)
Recent Articles
- Pyramiding PSU Bank Stocks September 22, 2023
- How to trade PSU banking stocks now.
- 5 Smallcap Stocks to Add to Your Watchlist Right Now September 12, 2023
- These smallcaps are looking good on the charts. Track them closely.
- Vodafone Idea - Can Idea Change Your Life? September 6, 2023
- What is the right way to trade Vodafone Idea?
- Repro Books Ltd: The Next Multibagger Penny Stock? August 28, 2023
- Is this the next big multibagger penny stock? Find out...


Equitymaster requests your view! Post a comment on "Push the Pedal Down on Auto Stocks". Click here!
Comments are moderated by Equitymaster, in accordance with the Terms of Use, and may not appear
on this article until they have been reviewed and deemed appropriate for posting.
In the meantime, you may want to share this article with your friends!