
Are We in a Bear Market?

This video is specifically to answer your very important query: Are we in a bear market?
With the help of multiple charts, I'll offer you my 360 degree worldview answer to this question.
Watch the video and let me know if you agree with my conclusion.
Hello friends. This is Vijay Bhambwani.
I hope my videos are helping you decipher messages of the markets a little more clearly than you used to before. This video is specifically to answer your query about...are we in a bear market?
The answer is not a simple one, because it's different for traders and different for non-market participants who are watching the markets from a slight distance.
Revealing on April 30: Are You Ready for the Upcoming Election Surprise?
Now you see, the classic Dow theory states that you are in a bear market if the security that you're tracking in this case the indices are at least 20% below their recent highs.
The peaks that were made on the Nifty and the Bank Nifty were in in third week of October 2021. So you could lay or hands on a holy book and say that the Nifty is not yet 20% below its all-time high of 18,600 odd levels and therefore, we are not in a bear market.
But like I said, the answer is slightly different, and it depends on whether you're actually trading or your watching the markets from a distance.
Now, why is it different for a trader for the simple reason that a trader, when he goes long and he finds the market coming down, he tends to roll over his long positions month after month.
Now, every time you roll over your long position, month after month, you incur what is known as a cost of carry or financing charges. You pay brokerage on squaring of the expiring month and creating a position in the following month. There are usual taxes and other charges, plus the mark up in price. That is, the cost of carry in the next month's future, so it adds on to your cost.
Unfortunately, these things do not reflect in stock price charts and the non-market participant goes by a stock price chart, which is hiding or unable rather to show all these actual costs that are incurred by actual traders. If you were to add the cost of carry, you will realise that you are in a bear market.
The other aspect, I want to show you a couple of charts and lots of charts compared to my other videos in the past.
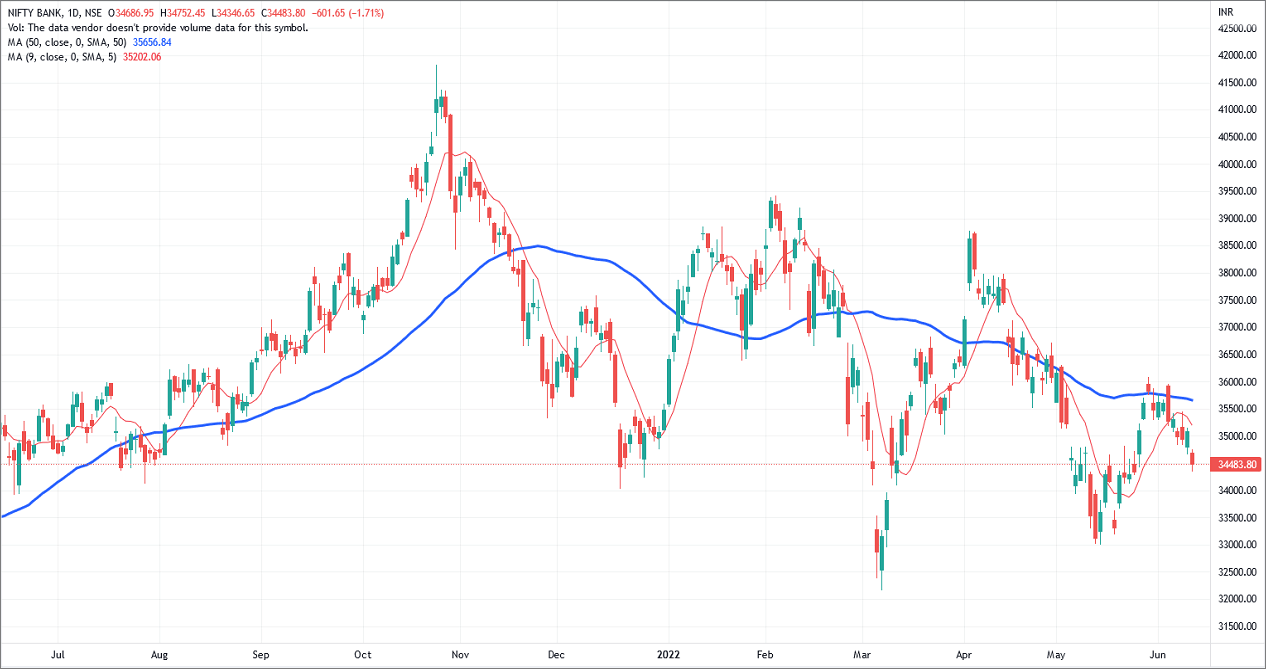
On your screen now is a daily chart of the Bank Nifty. This is a spot chart, and what I am showing you are two moving averages.
Number one is a 200 day moving average shown as a board line, it is approximately a one year holding on cost of a buy and hold delivery based investor. The other is a 50 day moving average shown by a relatively cleaner line. This is a medium term investor's holding on cost spanning around 3 to 5 months on average.
Whenever the 50 day moving average falls below the 200 day moving average, in technical language this is known as a death cross. You can see that the Bank Nifty has way clearly indicated a death cross on this chart.
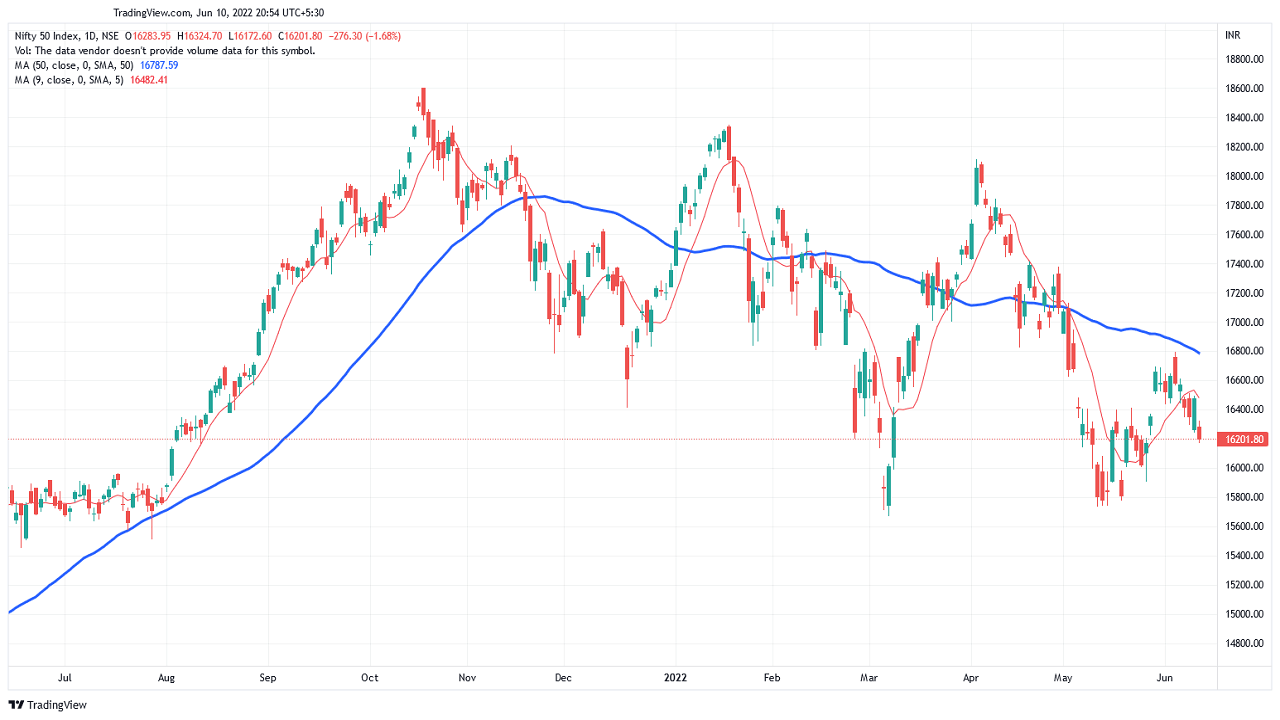
What about the Nifty 50 on your screen? Now is the chart, the daily chart of the Nifty 50, which tells you that a similar death cross has occurred on the Nifty as well.
So the short to medium term traders are now panicking. They are leading the market's down, and they are also impacting the 200 day moving average, which is a long period holding on costs, which is also tapering downwards in the case of the indices.
So if you don't want to admit that you're in a bear market, you will at least have to admit that you are in a bearish market, if not a bear market. But even by the classic Dow theory, the 20% decline from the peak has been achieved on the Bank Nifty, not yet achieved on the Nifty 50 which it will hit provided it falls below 14,800 odd levels.
We haven't gone there. So like I said, you could lay a hand on a holy book and say we are not in a bear market as far as the Nifty is concerned and I'm fine with it.
The next chart that I want to show you is the advance decline ratio.
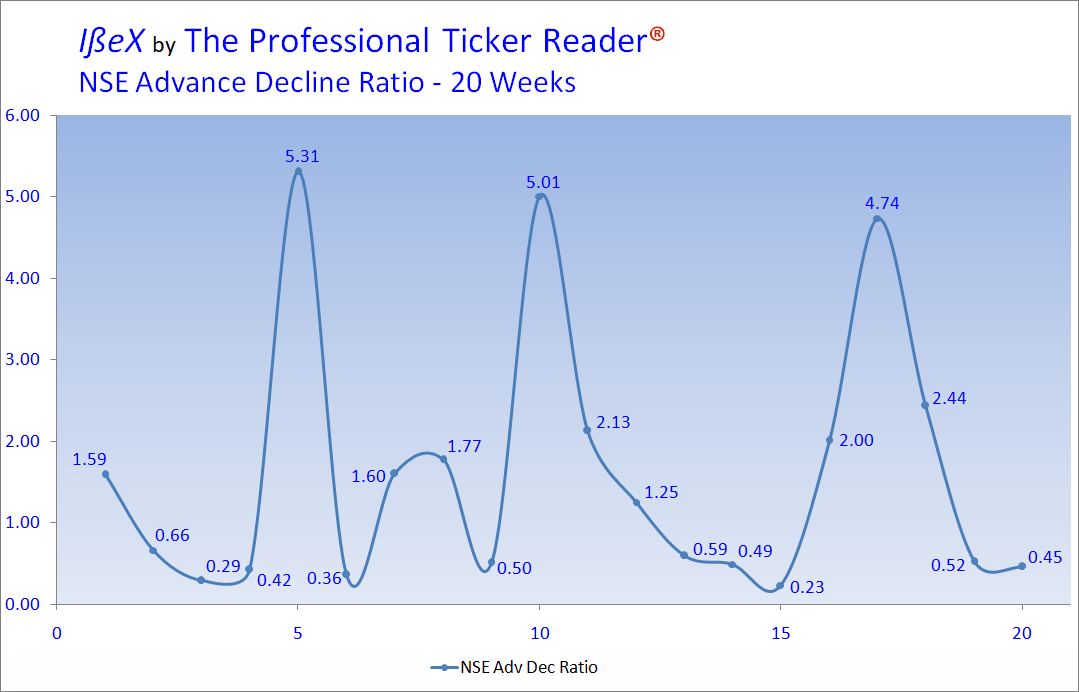
This is a very simple metric. It measures the risk appetite of the one marshmallow trader. Now who is the one marshmallow trader? It's somebody who trades intraday, squares of the position intraday, and does not roll over his position to the next trading session.
Now, between a trader who squares of position on the same day and the other trader who rolls over his position to the next day, the intraday trader is relatively weaker because he is unable to carry forward his position. Therefore, he's kind off a one marshmallow trader.
So the advance decline ratio is a gauge of the risk appetite of the one marshmallow traders. And this is a weekly chart. What I have taken his 20 weeks' time frame, which is a good four and a half months. What you can see is that the advance decline ratio is at the lower end of a 4.5 month period.
Now how do you calculate this advance decline ratio? It's very simple. If the advance decline ratio shows 1, it means for every gainer there is an equal number of losers. If the advance decline ratio shows 0.5, it means for 5 gainers, there are 10 losers.
Do I need to tell you that risk appetite is falling on a week on week basis since a fortnight and in a 20 weeks' timeframe? The risk appetite from one marshmallow traders is on the lower end of the band and therefore the markets are very clearly under pressure.
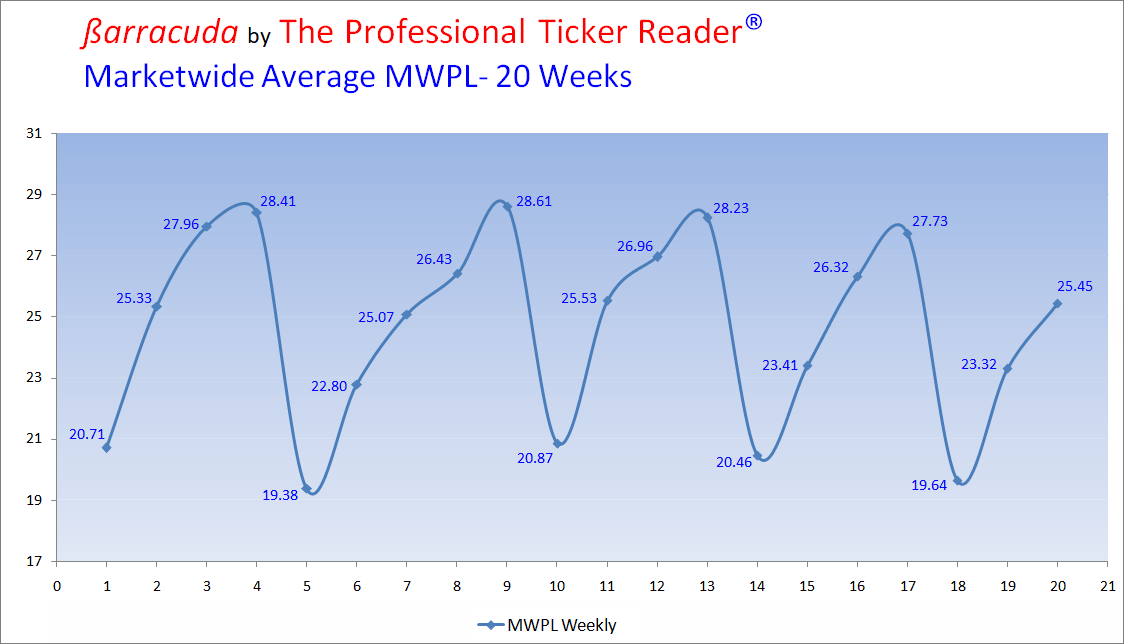
The second metric that I want to share with you is called the MWPL, or market wide position limits. What does this calculate? This basically calculates the amount of exposure that is actually utilised by real world traders as against the amount of exposure actually allowed by SEBI.
What I am basically trying to gauge here by trying to measure MWPL? The MWPL says, you can buy 100 units. Are traders actually buying 100 or less? The lesser they buy, the smaller is the risk appetite.
So what we are trying to do is gauge as to what people are actually doing. They might be saying anything at all because in financial markets talk is cheap. It is the actions that really matter. And on your screen now is the MWPL chart.
Here again, a weekly compression period with a look back period of 20 weeks. On 4.5 months, two things will come to your mind immediately. Number one on expiry, the MWPL figure falls significantly, which is routine, and the expiry of the month of May saw MWPL fall to a three month low, which means traders are actually surrendering their positions.
The other thing not shown in the chart because of time period constraints is that MWPL reached 35% on 16th of November 2021. It has never, ever seen that figure ever again. Every progressive or every consecutive expiring derivative expiry the MWPL has been falling. The peaks have been falling successively.
That tells you that risk appetite is falling, and in this figure itself, you can see that for four of five derivative cycles, we are not even going to 30% MWPL forget about 35% that we saw in November, which means traders are not biting the bait.
Now what category of traders risk appetite am I gauging in this MWPL? This is the two marshmallow traders who are stronger because they write a cheque to the broker, they roll over their position to the next trading day or next trading week or next trading month and say, okay, I'm going to stick around in this trade. These guys are very clearly on the fence.
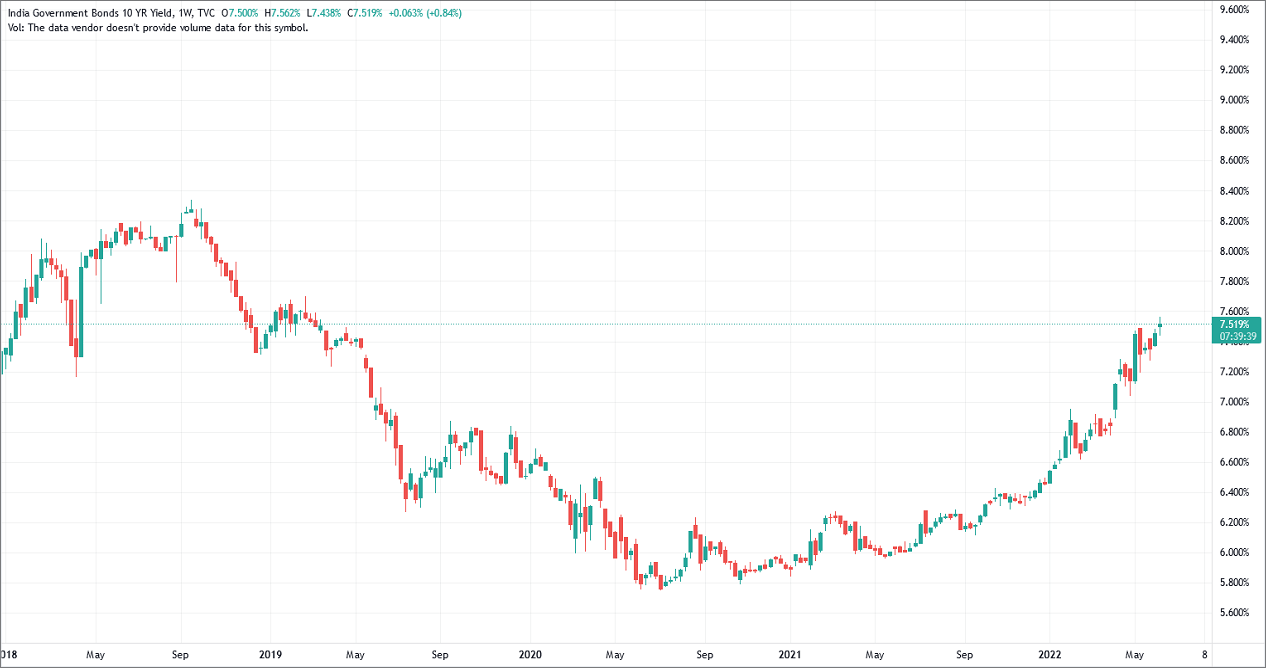
The last chart that I want to share with you and if you been long enough from watching my videos long enough, and you've been following me on my YouTube playlist here, you will know that I follow a 360 degree worldview, which incorporates all asset classes before I act on even one single asset class, and I'm a big coterie of fixed income, especially sovereign investments.
The chart that I am showing you is the 10 year benchmark sovereign yield of Indian bonds. You're saying that the bond yields are now at approximately at three year highs.
This means if you were to buy a government bond now from the secondary market, which you can from RBI's retail direct platform without any commission costs or brokerage because you're buying directly buying and selling directly to and from banks and there is a video that I have recorded in my playlist in October 2021 as to how you can avail of superlative returns, which are 100% guaranteed by the central government of India.
Now, why should this bond yield impact the stock market? Let me explain. You're now seeing bond yields hit 7.5% with the potential to go towards 8%. Do remember that this 8% return is 100% guaranteed by the government of India. Central Government of India compared that with approximately 6% yield on a bank fixed deposit, which is guaranteed only to the extent of Rs 5 lakh.
What would you do if you were to invest money in a fixed income instrument one which 100% guaranteed by the central government, which is yielding 7% and the other, which is yielding 6% and is guaranteed only to the extent of five lakhs?
You will pull money out of 6% and go towards 7% number one. The yield is higher. Number two, the safety's higher. This is what is happening to banks. People are pulling money out of fixed deposits and going to bonds.
Remember, when you put money in the bond market, it tends to stay there for longer periods of time. So liquidity is getting sucked out of equity markets and it is going into fixed income markets, which is leading equity prices lower. Should bond yields rise further, I can bet on the fact that the Nifty and the Bank Nifty will fall further.
The general consensus is that the RBI's Monetary Policy Committee meeting, the MPC, which is going to be held now in August, is probably likely to raise interest rates again after having raised 50 basis points, or half a percent, on eighth of June 2022.
So if cost of funds is going to rise, I think equity markets will feel the heat because cheap and easy availability of money is like mother's milk to a bull market. Now that the taps are being turned off, the cost of funds is going up and therefore liquidity is coming down.
This is an anathema to a bull market, which is why I am not willing to admit that this is a bull market and this is a mere technical correction. I think what we are witnessing are bear market rallies and you need to be extremely cautious because the strategies that you will follow in a bull market correction and a bear market rally are two radically different beasts.
Is there a possibility of making money in such markets? Yes, there are. You just need to change your outlook and instead of seeking buy opportunities you need to seek short selling opportunities.
When there is a problem in the market, which means the problem of making money, there are always solutions available, provided one applies one's mind to it, because the market is all about market mind games. So for every challenge, there is a solution.
On this optimistic note I bid goodbye to you, not before reminding you to click like on my video if you liked what you saw. Subscribe to my YouTube channel if you haven't already done so. Good bad or ugly, I'd love to hear from my viewers and their feedback in the comments section. And please help me reach out to fellow like-minded smart traders like yourselves by referring my video to your family and friends.
Thank you for being patient with me and watching my video. Till be meet again in my next, this is Vijay Bhambwani signing off for now. I wish you have a very profitable week ahead.
Bye and thank you.
Warm regards,
![]()
Vijay L Bhambwani
Editor, Fast Profits Daily
Equitymaster Agora Research Private Limited (Research Analyst)
Recent Articles
- Pyramiding PSU Bank Stocks September 22, 2023
- How to trade PSU banking stocks now.
- 5 Smallcap Stocks to Add to Your Watchlist Right Now September 12, 2023
- These smallcaps are looking good on the charts. Track them closely.
- Vodafone Idea - Can Idea Change Your Life? September 6, 2023
- What is the right way to trade Vodafone Idea?
- Repro Books Ltd: The Next Multibagger Penny Stock? August 28, 2023
- Is this the next big multibagger penny stock? Find out...
Equitymaster requests your view! Post a comment on "Are We in a Bear Market?". Click here!
1 Responses to "Are We in a Bear Market?"
ABOUT EQUITYMASTER
Since 1996, Equitymaster has been the source for honest and credible opinions on investing in India. With solid research and in-depth analysis Equitymaster is dedicated towards making its readers- smarter, more confident and richer every day. Here's why hundreds of thousands of readers spread across more than 70 countries Trust Equitymaster.
PREMIUM PRODUCTS
QUICK LINKS
POPULAR TOPICS
- Multibagger Penny Stocks
- Basics of Value Investing
- Benjamin Graham
- How to Invest in Gold
- How to Invest in Silver
- Best Stocks to Buy Today
- Best Small-cap Stocks to Buy
- Best Bluechip Stocks to Buy
- Guide to Penny Stocks
- How to Invest in the Share Market
- Warren Buffett - The Value Investor
- Pick the Best Multibagger Stocks
TRENDING TOPICS
 Donate to credible NGOs in the sector of your choice (ii) Claim 50% tax benefit u/s 80G (iii) Receive periodic reports.")
Copyright © Equitymaster Agora Research Private Limited.
Whitelist | Refer | Terms | Privacy | Contact | About | Sitemap
Equitymaster Agora Research Private Limited (Research Analyst)
SEBI (Research Analysts) Regulations 2014, Registration No. INH000000537.
103, Regent Chambers, Above Status Restaurant, Nariman Point, Mumbai - 400 021. India.
Telephone: +91-22-61434055. Email: info@equitymaster.com. Website: www.equitymaster.com.
CIN:U74999MH2007PTC175407
Name of the Compliance & Grievance Officer: Ms Sonal Ramachandran
Telephone: +91-22-61434003 | Email: compliance@equitymaster.com
LEGAL DISCLAIMER:
Investment in securities market are subject to market risks. Read all the related documents carefully before investing.
Registration granted by SEBI and certification from NISM in no way guarantee performance of the intermediary or provide any assurance of returns to investors.
All rights reserved. Any act of copying, reproducing or distributing this newsletter whether wholly or in part, for any purpose without the permission of Equitymaster is strictly prohibited and shall be deemed to be copyright infringement.
Equitymaster Agora Research Private Limited (Research Analyst) bearing Registration No. INH000000537 (hereinafter referred as 'Equitymaster') is an independent equity research Company. Equitymaster is not an Investment Adviser. Information herein should be regarded as a resource only and should be used at one's own risk. This is not an offer to sell or solicitation to buy any securities and Equitymaster will not be liable for any losses incurred or investment(s) made or decisions taken/or not taken based on the information provided herein. Information contained herein does not constitute investment advice or a personal recommendation or take into account the particular investment objectives, financial situations, or needs of individual subscribers. Before acting on any recommendation, subscribers should consider whether it is suitable for their particular circumstances and, if necessary, seek an independent professional advice. This is not directed for access or use by anyone in a country, especially, USA, Canada or the European Union countries, where such use or access is unlawful or which may subject Equitymaster or its affiliates to any registration or licensing requirement. All content and information is provided on an 'As Is' basis by Equitymaster. Information herein is believed to be reliable but Equitymaster does not warrant its completeness or accuracy and expressly disclaims all warranties and conditions of any kind, whether express or implied. Equitymaster may hold shares in the company/ies discussed herein. As a condition to accessing Equitymaster content and website, you agree to our Terms and Conditions of Use, available here. The performance data quoted represents past performance and does not guarantee future results.
Rajeev Mundra
Jun 14, 2022Extremely insightful. The A/D ratio and MWPL charts were good. As in every bull market, it is retail investors that are stuck in the end. This time also, retail investors will be stuck via exposure to direct equity, PMS and mutual funds.
Also, with the cryptocurrency markets crashing, there is going to be some collateral damage on riskier asset classes like equities, startups and VC funding.
We should expect Nifty to revert to its mean price earnings ratio, at the minimum.