
Time to Invest in Real Estate Stocks

Real estate stocks are looking good on the charts.
In volatile markets, these stocks are usually shunned but I think it's a good opportunity to buy them.
With the help of four charts I'll show you why I think investors should buy these stocks now.
Watch the video and let me know your thoughts.
Hello viewers. Welcome the Fast Profits Daily. Myself Brijesh Bhatia.
Markets have corrected right from 18,100 back towards nearly 52-week lows of 15,183 levels and in this market as an investor, I think it is an excellent opportunity for a long-term investor to look for the sectors which are outperforming or the stocks which are outperforming, or the stocks which you think the fundamentals are very, very strong, the stocks which are in the current market scenario trending at 52-week high or near a 52-week high.
Don't Miss: Best Chance to Access Midcap Stocks Research at 80% OFF
But one sector, I think after consolidation of 10 years, the breakout has happened, the re-test has happened. It's an excellent opportunity in this sector, one should look for as an investment per se.
Let's look at the first chart and as you have seen the headline, realty sector is the one I believe offers an excellent opportunity for investors looking for 3 to 5 years' time frame.
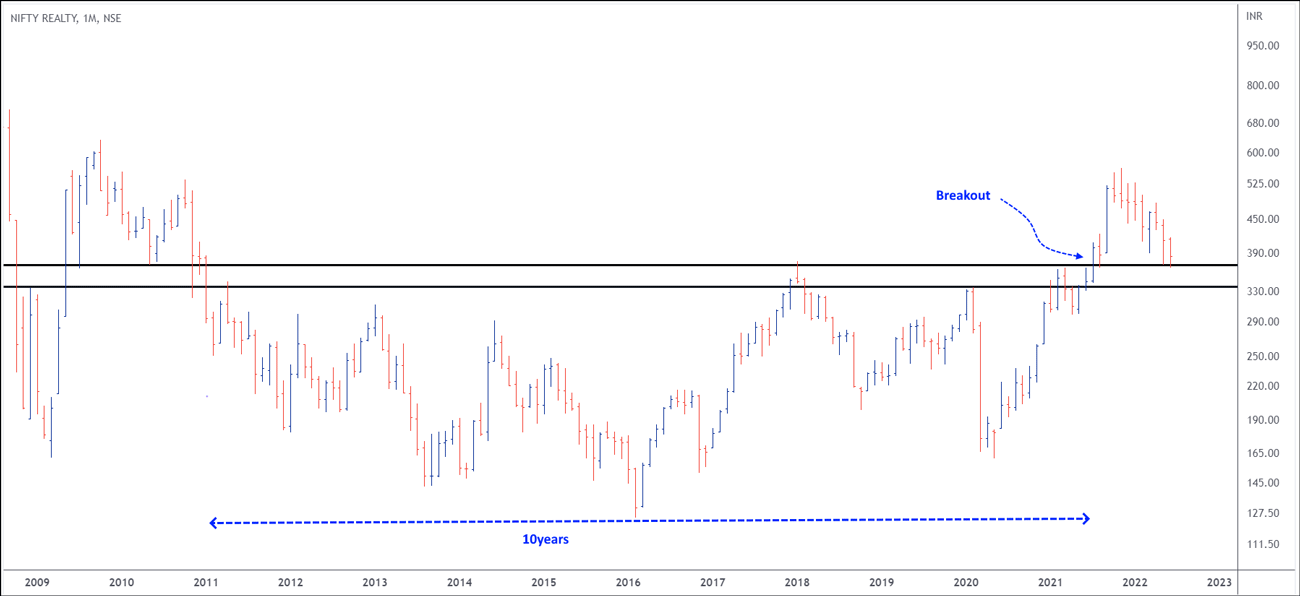
Let's look at the first chart over here. This is the monthly chart of the Realty Index and I have done a video on the same a few months back as well when the sector was breaking out of its 10 years consolidation.
We saw in July 2021, when this breakout happened at around 360-370 levels, it went to the highs of 560 where markets were also trending very, very bullish.
As the market has seen a downtick, this sector has also seen a correction right from 560 back towards 370-375 levels now, and being a volatile sector generally, it tends to move when the markets are very, very volatile.
But if you look at the monthly chart over here, the breakout happened right at 360. Prices are coming back toward 360 right around the consolidation zone breakout, which was again the previous highs.
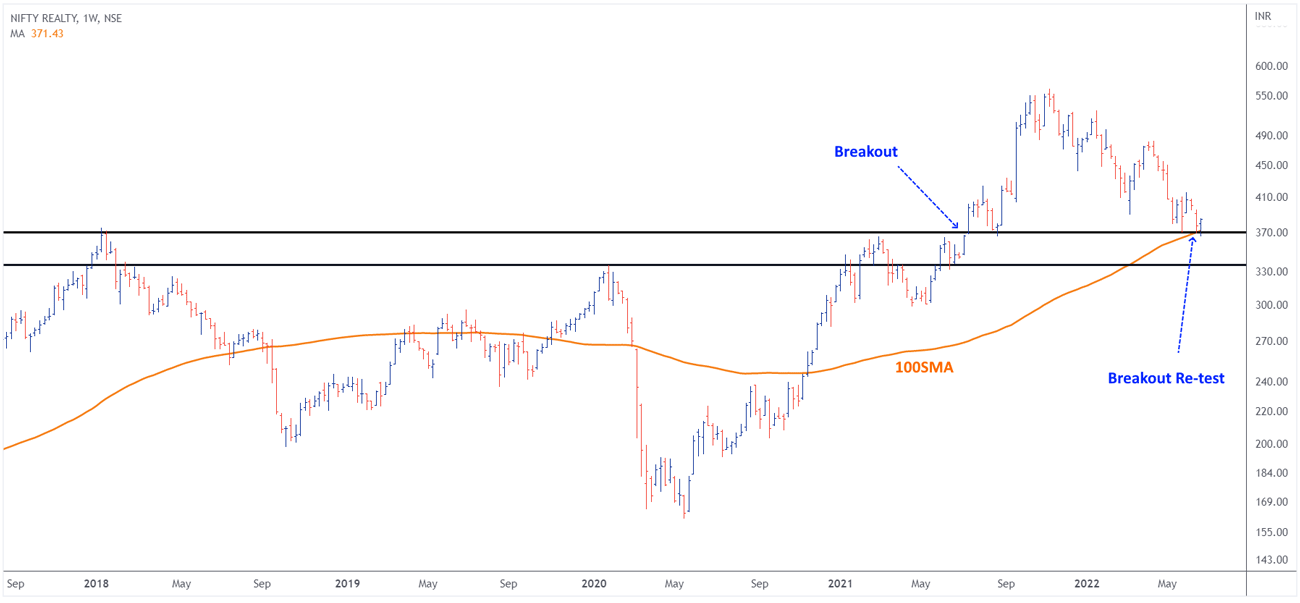
If I look at the top-down approach over here and move on to the weekly chart, again, the same breakout which happened at 360, being re-tested at around 360 levels again nearly after a year. And if you look at the consolidation when the markets have seen a huge correction right from around 16,800 to 15,200, this sector has shown some steadiness as it fell from around 400 back towards 360. But if you look at the momentum, it is holding quite very, very strong at the crucial re-test level.
Look at the orange line over here, the 100 simple moving average, 100 weekly moving average, has been placed right around the re-test of the breakout levels now. So momentum here indicates that the structure seems to be a very, very bullish over here.
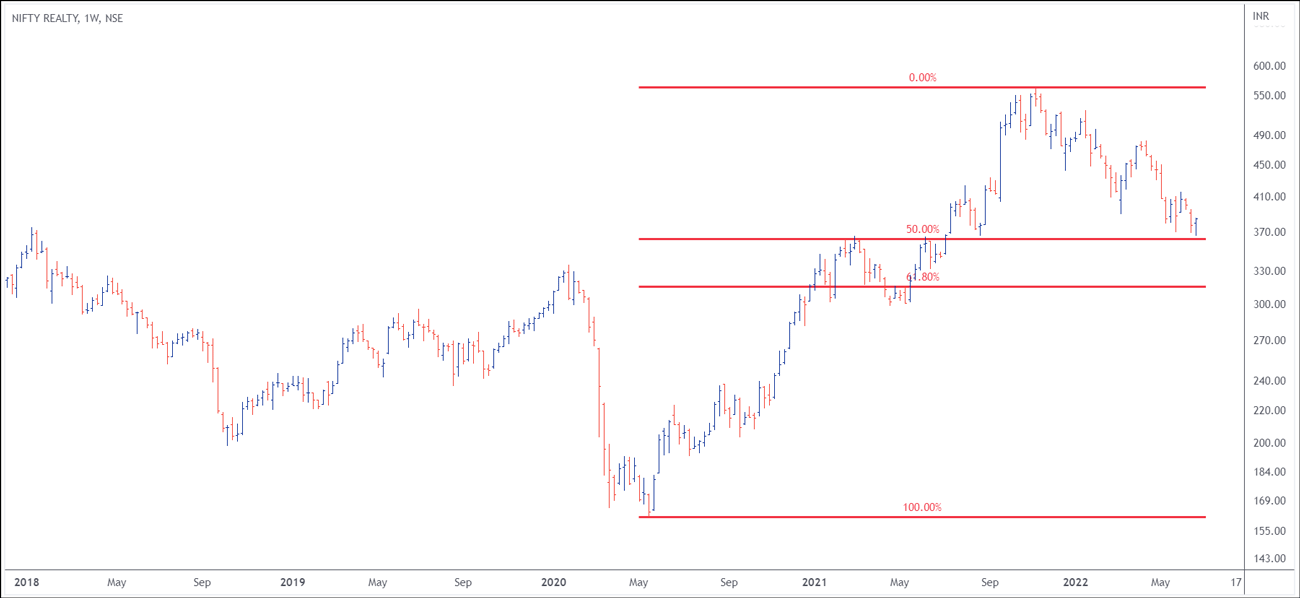
If I just add the Fibonacci level over here, if you look at the third chart where I've added the Fibonacci level right from the 160 low to the high of 560, the 50% retracement comes to around 360 which coincides with the breakout re-test level.
If you look at the previous highs, which was somewhere around 320 or 315, it coincides with 61.8% Fibonacci retracement.
So 315-320 on the lower side to 360-370 bands, stands out to be a very, very excellent opportunity for investors to look into this sector.
if I just look at the one chart, which is convincing me that the realty could outperform in the next couple of years, or probably 2-5 years is this ratio chart.
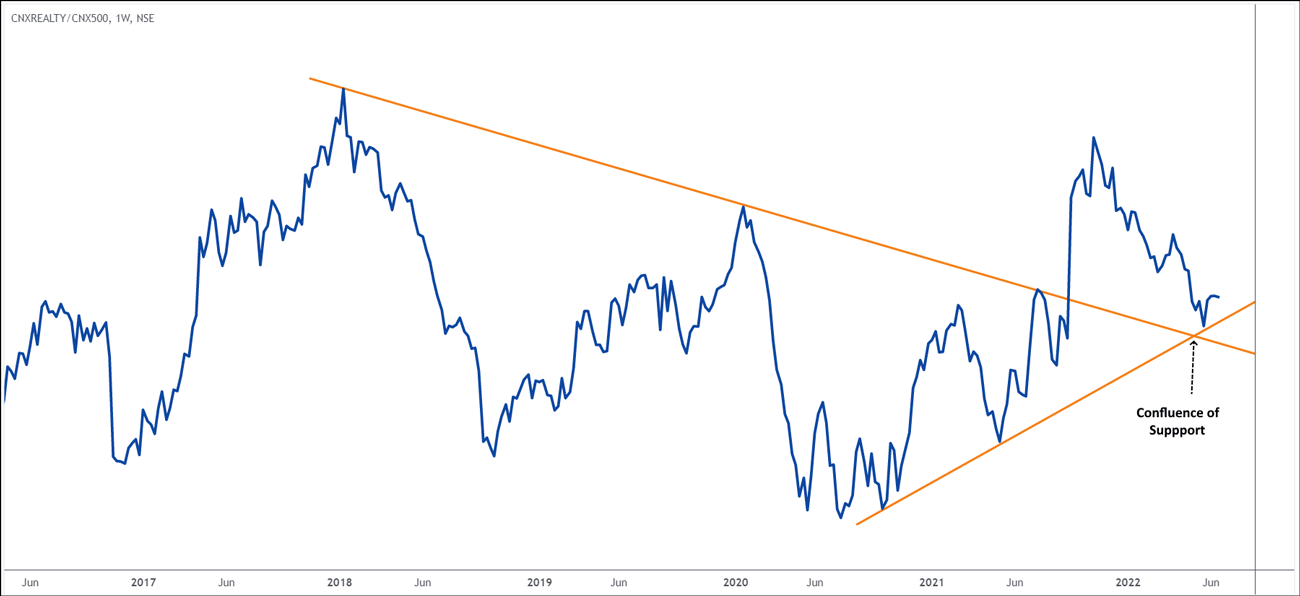
So if you look at this chart over here, this is realty index divided by Nifty 500 or CNX 500. The reason to take Nifty 500 is because if you look and a Nifty 50 the realty component is very, very lower. And if I look at the Nifty 500, it covers the broader space of largecaps, midcaps, and a few small caps as well. the Nifty 500 covers the more market breath. The reason to take realty divided by Nifty 5oo was to cover all of the market.
Look over the structure, it broke out of the triangle formation last year. It went higher. When prices tested 560, it was outperforming by a huge margin against the CNX 500 and coming back to re-test that break out.
If you look at the lower line over here which I have extended the triangle, the lower line of the triangle, there is a support placed right at around the crucial re-test level. So the confluence of supports over here on the ratio charts indicates that the tide may turn higher, which means that realty index could outperform against the Nifty 500 or CNX 500 in the coming few weeks or few months, and one should definitely look at the realty space as an investment sector for next 2 to 5 years.
Signing off, Brijesh Bhatia.
Warm regards,

Brijesh Bhatia
Research Analyst, Fast Profit Report
Equitymaster Agora Research Private Limited (Research Analyst)
Recent Articles
- Pyramiding PSU Bank Stocks September 22, 2023
- How to trade PSU banking stocks now.
- 5 Smallcap Stocks to Add to Your Watchlist Right Now September 12, 2023
- These smallcaps are looking good on the charts. Track them closely.
- Vodafone Idea - Can Idea Change Your Life? September 6, 2023
- What is the right way to trade Vodafone Idea?
- Repro Books Ltd: The Next Multibagger Penny Stock? August 28, 2023
- Is this the next big multibagger penny stock? Find out...
ABOUT EQUITYMASTER
Since 1996, Equitymaster has been the source for honest and credible opinions on investing in India. With solid research and in-depth analysis Equitymaster is dedicated towards making its readers- smarter, more confident and richer every day. Here's why hundreds of thousands of readers spread across more than 70 countries Trust Equitymaster.
PREMIUM PRODUCTS
QUICK LINKS
POPULAR TOPICS
- Multibagger Penny Stocks
- Basics of Value Investing
- Benjamin Graham
- How to Invest in Gold
- How to Invest in Silver
- Best Stocks to Buy Today
- Best Small-cap Stocks to Buy
- Best Bluechip Stocks to Buy
- Guide to Penny Stocks
- How to Invest in the Share Market
- Warren Buffett - The Value Investor
- Pick the Best Multibagger Stocks
TRENDING TOPICS
 Donate to credible NGOs in the sector of your choice (ii) Claim 50% tax benefit u/s 80G (iii) Receive periodic reports.")
Copyright © Equitymaster Agora Research Private Limited.
Whitelist | Refer | Terms | Privacy | Contact | About | Sitemap
Equitymaster Agora Research Private Limited (Research Analyst)
SEBI (Research Analysts) Regulations 2014, Registration No. INH000000537.
103, Regent Chambers, Above Status Restaurant, Nariman Point, Mumbai - 400 021. India.
Telephone: +91-22-61434055. Email: info@equitymaster.com. Website: www.equitymaster.com.
CIN:U74999MH2007PTC175407
Name of the Compliance & Grievance Officer: Ms Sonal Ramachandran
Telephone: +91-22-61434003 | Email: compliance@equitymaster.com
LEGAL DISCLAIMER:
Investment in securities market are subject to market risks. Read all the related documents carefully before investing.
Registration granted by SEBI and certification from NISM in no way guarantee performance of the intermediary or provide any assurance of returns to investors.
All rights reserved. Any act of copying, reproducing or distributing this newsletter whether wholly or in part, for any purpose without the permission of Equitymaster is strictly prohibited and shall be deemed to be copyright infringement.
Equitymaster Agora Research Private Limited (Research Analyst) bearing Registration No. INH000000537 (hereinafter referred as 'Equitymaster') is an independent equity research Company. Equitymaster is not an Investment Adviser. Information herein should be regarded as a resource only and should be used at one's own risk. This is not an offer to sell or solicitation to buy any securities and Equitymaster will not be liable for any losses incurred or investment(s) made or decisions taken/or not taken based on the information provided herein. Information contained herein does not constitute investment advice or a personal recommendation or take into account the particular investment objectives, financial situations, or needs of individual subscribers. Before acting on any recommendation, subscribers should consider whether it is suitable for their particular circumstances and, if necessary, seek an independent professional advice. This is not directed for access or use by anyone in a country, especially, USA, Canada or the European Union countries, where such use or access is unlawful or which may subject Equitymaster or its affiliates to any registration or licensing requirement. All content and information is provided on an 'As Is' basis by Equitymaster. Information herein is believed to be reliable but Equitymaster does not warrant its completeness or accuracy and expressly disclaims all warranties and conditions of any kind, whether express or implied. Equitymaster may hold shares in the company/ies discussed herein. As a condition to accessing Equitymaster content and website, you agree to our Terms and Conditions of Use, available here. The performance data quoted represents past performance and does not guarantee future results.
Equitymaster requests your view! Post a comment on "Time to Invest in Real Estate Stocks". Click here!
Comments are moderated by Equitymaster, in accordance with the Terms of Use, and may not appear
on this article until they have been reviewed and deemed appropriate for posting.
In the meantime, you may want to share this article with your friends!