I'm Bullish on these Stocks

For many years capital good stocks have underperformed the rest of the market. Many investors gave up on them.
But things are changing. These stocks are looking good on the charts once again.
In this video, I'll explain why I'm bullish on these stocks with the help of my detailed charts.
Watch the video and let me know what you think.
Hello subscribers. Welcome to the Fast Profits Daily. Myself Brijesh Bhatia.
Starting on with the markets, we have seen markets coming back very, very strongly and reclaiming around 17,500 levels now. Though, it being a truncated week, we have managed to close about 17,500 and it's been very, very bullish scenario coming right from 15,200 back to 17,500.
There are various sectors which have lead the rally. On the Nifty weights, there are some index which are lagging, and in the second leg of the rally, when markets have reached above 16,800, they have come back very, very strongly.
One such index, on which I am very, very bullish is cap goods. Let's look at the constituents of BSE Capital Goods index.
| Company | Weightage |
|---|---|
| LARSEN & TOUBRO LTD | 26.90% |
| SIEMENS LTD | 10.48% |
| HINDUSTAN AERONAUTICS LTD | 7.56% |
| BHARAT ELECTRONICS LTD | 7.18% |
| ABB INDIA LTD | 6.03% |
| SCHAEFFLER INDIA LTD | 4.61% |
| HONEYWELL AUTOMATION INDIA LTD | 3.75% |
| POLYCAB INDIA LTD | 3.70% |
| BHARAT FORGE LTD | 3.47% |
| SONA BLW PRECISION FORGINGS LTD | 3.43% |
| THERMAX LTD | 2.58% |
| AIA ENGINEERING LTD | 2.37% |
| TIMKEN INDIA LTD | 2.35% |
| GRINDWELL NORTON LTD | 2.31% |
| SKF INDIA LTD | 2.23% |
| BHARAT HEAVY ELECTRICALS LTD | 1.89% |
| CARBORUNDUM UNIVERSAL LTD | 1.67% |
| ELGI EQUIPMENTS LTD | 1.43% |
| LAKSHMI MACHINE WORKS LTD | 1.18% |
| VGUARD INDUSTRIES LTD | 1.08% |
| GRAPHITE INDIA LTD | 0.84% |
| SUZLON ENERGY LTD | 0.79% |
| KNR CONSTRUCTION LTD | 0.76% |
| PRAJ INDUSTRIES LTD | 0.73% |
| FINOLEX CABLES LTD | 0.68% |
So if you look at the screen, it's been led by L&T, which holds around 26-27%, followed by Siemens, which is around 7%. HAL and BEL hold around 7-7.5%, and then followed by ABB which holds around 6%. There are a number of others on the list over here on your screen which holds weights over here.

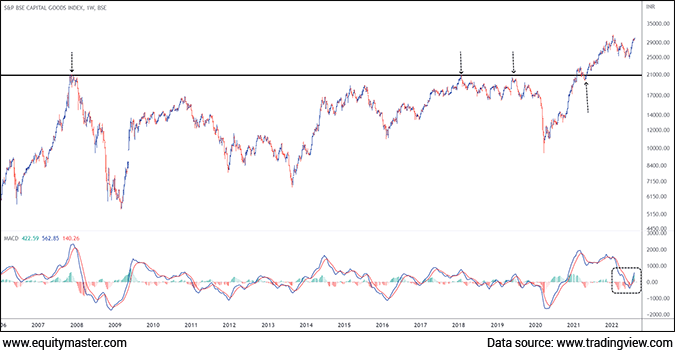
If I just look at the charts over here, if I can start with the daily chart on your screen, if you look right from 2007, this index has slight ups and downs. Majorly since 2016, it has been underperforming and staying around the same levels when Nifty has gone much higher, Sensex has gone much higher, and this index has been slightly underperforming.
We will look at the performance of the BSE Cap Goods index against Sensex in the later part of the video. But if you look at the structure over here, the resistance, which was acting at around the 2007 highs, the 2016 highs, the 2018 highs, has finally broke down in 2021.
We saw a rally. We saw a retest at the right extreme air marked where the up arrow is marked. If look at the breakout, the retest has happened and the journey continued on to the bullish side. So it indicates that the resistance, which was acting for quite long, for years, is acting as a support now.
At the same time, you look at the lower panel of the MACD which is the moving average convergence divergence, the average has given a positive crossover and most importantly, it has given a positive crossover at the integer line which is the zero line. And the histogram is also trending bullish.
This indicates that the momentum is very, very strong on weekly chart, which is a medium to long term chart. The trend is building up on long side.
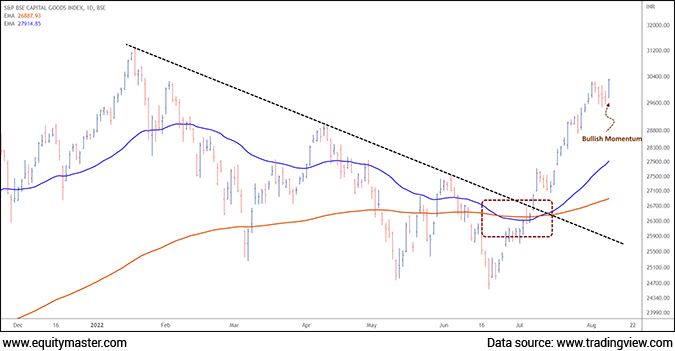
If I use the top down approach and move to the daily chart on your screen, look at the structure over here.

If you look at these two averages, the blue is the 50 days average and the orange is the 200 days average.
So since year 2021 break out, it was trending in a golden cross. The golden cross is when 50, the short term average is trending above the long term average.
Between the fall of June and July, it gave a death cross, but it was for a few days and then again, we have seen a bullish momentum coming back into the golden cross again.
If you look at his black falling line, it is a trend line which has given a break out of the resistance line. The lower high, lower low structure has been indicates and even if you look at the weekly there is a bullish break out.
Now over here, it has been giving a good upside momentum onto the charts, which indicate that the structure is very, very bullish and there's the higher high, higher low structure on the charts.
If you look at yesterday's momentum, which was Monday, look the structure where it has given right from the 9:15 open, it went higher and higher. If you look at the previous four red bars, we have seen a momentum continue on the bullish side. It indicates that yes the structure is very, very bullish. One should definitely look at trading the capital goods index.

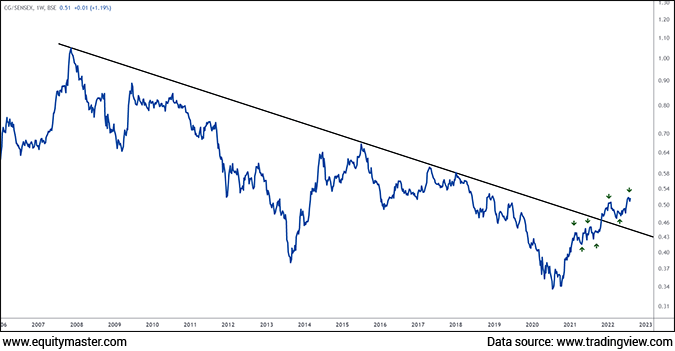
Look at the ratio chart on your screen over here which is the Cap Goods divided by Sensex. The ratio charts are used to measure the performance of one instrument over the other. So if I just look at the Capital Goods index performance over the Sensex over here, look at the structure over here.
Since 2007, if you look at the extreme left on your screen, since 2007 highs, this index was underperforming the Sensex.
Back into the break out. If you look at the black arrow, we saw a break out, right in 2022 where 2021-2022 was a retest and look at the green arrow over, which is indicating the higher high, higher low structure. So with the break out, right from 2007, which is around 14 years of break out, and the prices continuing with the bullish momentum, it indicates that capital goods index is well placed.
Even if you look at the short term, medium term, or long term, I believe a capital goods index one should definitely look at. Not only the likes of L&T or the like of Siemens but even ABB, HAL, BEL, are outperforming on a large scale. Even if you look at the L&T it has seen good upside. Siemens has been trending at about 2,800.
If you are our subscriber, you may know in the last special report which we have released, the capex cycle 2.0, you can read that report, we have highlighted how this capex cycle back in 2000, early 2000 to 2007 played, and a similar in structure is developing.
So I believe capital goods index is getting a relief from a short to long term and definitely looks as an investment venue.
Signing off, Brijesh Bhatia.
Warm regards,

Brijesh Bhatia
Research Analyst, Fast Profit Report
Equitymaster Agora Research Private Limited (Research Analyst)
Recent Articles
- Pyramiding PSU Bank Stocks September 22, 2023
- How to trade PSU banking stocks now.
- 5 Smallcap Stocks to Add to Your Watchlist Right Now September 12, 2023
- These smallcaps are looking good on the charts. Track them closely.
- Vodafone Idea - Can Idea Change Your Life? September 6, 2023
- What is the right way to trade Vodafone Idea?
- Repro Books Ltd: The Next Multibagger Penny Stock? August 28, 2023
- Is this the next big multibagger penny stock? Find out...


Equitymaster requests your view! Post a comment on "I'm Bullish on these Stocks". Click here!
Comments are moderated by Equitymaster, in accordance with the Terms of Use, and may not appear
on this article until they have been reviewed and deemed appropriate for posting.
In the meantime, you may want to share this article with your friends!