
My Secret Nifty Trading Strategy

This is a detailed video on my trading strategy for the Nifty.
With the help of many charts, I'll show you exactly how I trade the Nifty and how you can do the same.
Watch the video and let me know what you think about the strategy.
I would love to hear your feedback.
Hello subscribers. Welcome to the Fast Profits Daily. Myself, Brijesh Bhatia.
In this video, I'll be discussing my secret Nifty trading strategy. In this strategy, I'll be discussing only the price action movement without any indicator, without any oscillators, without any moving averages.
It's been one of the systems which I have been following for many years now, and as a trader, trading the Nifty is very, very a liquid instrument, volatile, I would say, a good momentum instrument where you can gain good trades in a day or probably, a holding period of two to three days.
Don't Miss: Best Chance to Access Midcap Stocks Research at 80% OFF
Again this is not focusing on just intraday. I am a swing trader and not an intraday trader. So I have defined a system which helps me to stay out of the screen at times where I am required to do other stuff. I don't want to be in a time where I should be in front of screen every day, right from 9:15 to 3:30 AM.
Most importantly, I have defined a system where there is a trade at a fixed time during a day. So a couple of minutes at that point of time looking at the charts, looking at the trades, it is there are not, and entering into a trade, is very, very important.
So let's start with the system. I'll share my screen with you.
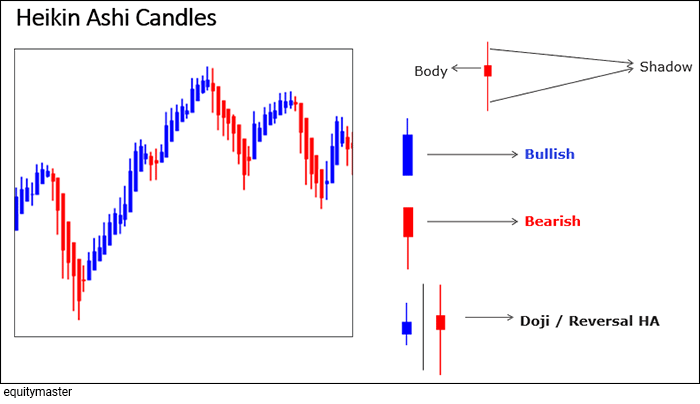
So the system is defined or developed on a base of Heikin Ashi candlestick pattern. So basically what is Heikin Ashi? It's slightly different from the bar or normal candlestick what you have been following for quite long.
So in the candlestick pattern, there are a number of patterns, hammer shooting star, doji bullish engulfing, bearish engulfing, abandoned baby, homing pigeon, a number of stuff. But in the Heikin Ashi, there are only type of candles.
If you look at the structure, it's remains same as what the candlestick is. There is body and there is a shadow. The bullish candlestick is where the open and low are the same. There's a bearish candlestick where the open and high are the same, and there is a doji where you have a shadow on both the sides.
The formation is different from the candlestick. So you don't need to do the candlestick formation. There is a chart, a number of charts, available on free websites or the free trading software you are using. So there are a number of systems which are giving Heikin Ashi now.
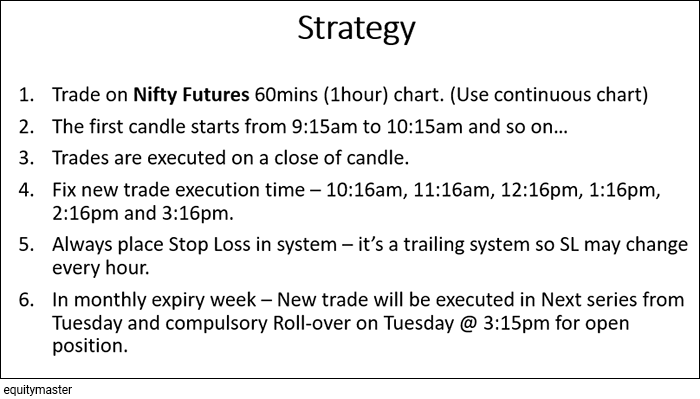
So what is the strategy all about? So there are some of rules in the strategy which I follow. It is being traded on Nifty futures, and I have been using Nifty 60 minutes or one-hour charts. It'd been a continuous chart.
The chart symbol, which is that if you are following the continuous chart, till the expiry date, it will be showing the current expiry, and as soon as the expiry is complete, on the Friday, the next series starts with the end of the current series. But there is a slight change in the expiry which I'll be discussing with you.
The first candle starts right at 9:15 to 10:15 am. The second 10:15 to 11:15 am. The third 11:15 to 12:15 and so on. Those people who are using the hourly candle from 9:30 to 10:30, you have to change from 9:15 10:15. Every software has this setting. So you can go into the setting and change it.
Trades are executed on the closing of each candle or Heikin Ashi candle right from 9:15 to 10:15, the candle is closed at 10:15. If there is a trade set up, you have to execute right at 10:16. So there is a fixed time where I am implementing the trades. The fixed times are 10:16 am which is the close of the candle of 10:15, then 11:15 close candle, so execution will be 11:16, then 12:16, 1:16, 2:16, and 3:16.
So these are fixed execution times. So you need not have to be in front of a screen all the time. So when the candle closes, I'm looking for new trades. Again, I am repeating, this is for the new trades, these fixed times are there.
Always place a stop loss in the system. This being a trailing stop loss system you will always have the stop loss level, so you have to place the stop loss into the system.
Every morning if trade is open at 3:30, place the stop loss right and 9:15 am or in case it's opening about or below the stop loss level, exit at whatever price it is. There may be a possibility that there may be a gap or gap down, which is against your stop loss level. So right at 9:16, as soon as markets open, close the trades right at the open.
In the monthly expiry week, which is as of now, this is a monthly expiry week, we have 25th August of expiry. We are on 24th. So new a new trade right from Tuesday, which is in the expiry week, which was on 23rd of August of the current expiry, in case there is a new trade on Tuesday, you will do a trade in the next series.
This means in case, on 22nd of August, I get a new trade, I'll execute that in the next series in a monthly expiry week. Compulsory roll over is on Tuesday, which is 3:15 pm, in case there is an open position.
Sometimes you can do on Wednesdays as well because it is an index. It won't make much difference, but I generally follow Tuesday or Wednesday. Whatever you like, you can do. Tuesday is the best time, generally at 3:15.
Now what are the strategies of entry and exit?
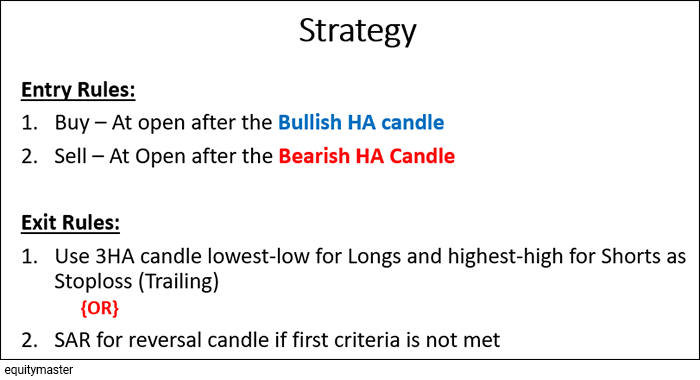
So entry rules. Buy at open after a bullish Heikin Ashi candle is formed. So HF means Heikin Ashi candle. I'll explain the trades as well over here. So buy at open when bullish Heikin Ashi candle is formed. Sell at open when bearish Heikin Ashi candle is formed.
Exit rules. Use three Heikin Ashi candles. Lowest low for longs and highest high for shorts as a stop loss. Or there is SAR which is for a reversal candle if the first criteria is not met. I'll explain what the SAR is all about.
So let's look at the charts over here. So if I just look, there are two charts on your screen, the left and right. If there is a Heikin Ashi candle over here. So if you look at this candle, 19th August 11:15 am. So we had a bearish candle over here.
So if you look at the price change on your left, I just plotted the cross on the bar of 19th August 11:15 am. So if you look at the left chart, which is Heikin Ashi chart, and the right chart, which is the bar chart, you may see open, high, close, and low changes over there. So Heikin Ashi are calculated based on the averages of the previous candle as well.
So keep a watch on this if there is a bearish candle over here. So the open and high over here. 17,941.95. Look at the left over here, the Heikin Ashi. Open and high are the same. So I'll execute the trade right at 12:16. The 11:15 candle closed. I'll execute a trade right at 12:16 when this candle opens.
Now if you look at the right screen over here, 11,811 is the open over here. So I'll execute the trade right at 11:17, it won't make much difference over here. So look at the trade over here.
I have been showing the strait for the August series, and in this scenario to just explain, I have not taken a rollover or I've done into the August series as well. I have not gone into the September series, when the new trade happened just to show the candles over here.
But in an actual trade, you have the last trade which will be there probably in case if it's on Tuesday, you have to execute in the next series. But just to explain the candle over here, I have just taken the current series.
So if I just look at a short over here, the rules says that execute the trade at the open of the next candle. So at 17,810, I'll execute the trade. So this is my execution candle. So let me write a note. This is an execution candle. Executed shorts at 17,810. Skipping a rupee cushion over here. Executed a short trade over here.
So my stop loss is highest high of three candles, Heikin Ashi candles on a short trade. If, in case it is a long trade, I'll look at the lowest low of three candles. So here 1, 2, and 3. The highest high was 17,989.95. So 17,990 is my stop loss or probably you can keep a point of 991. So 1 point won't make a difference. So 17,990 is my stop loss as per my system.
What I'll do is, I use a trading system over here. So every three candles high, I trail the stop loss. So when as soon as it closes on 1:15, when this candle closed, my stop loss from here will change to here. So the high of 17,990, the stop loss will change to 17,972. The high is 17,971.95. So I'm taking 72 or 73, Rs 1 here and there.
As soon as the trailing system happens, I'll move the stop loss and I keep the stock loss into the system. Now, look at the prices over here. We have seen a huge of uptick over here. Look at the previous three candle highs. My stop loss was 17,589. Probably we may have hit over here. So if you look at the structure, the momentum happened and we had a new trade closed over here.
If I just go on to the long trades now, over year, we had a bullish Heikin Ashi candle yesterday. Again, I'm repeating I've taken this current contract because just to explain the candle over here. 23rd August was the Tuesday. So as per the system I have to execute trading September series. But just to explain, I've taken it as August.
On 23rd August, at 1:15 pm, we got a bullish candle. If I go onto the previous candle at 12:15 to 1:15, that was a doji because at open, we had a shadow on both sides. So 1:15 candle was a bullish candle.
As soon as the candle closed at 2:15, so 2:16 is my trade execution time. I executed a trade at 2:16 pm at 17,592, keeping a stock loss of 17,431.25.
So if it has open the Excel over here, so I have executed at 2:15. So I have just taken 11:15 close. So 2:16 would be the entry time. The close of the 2:15 candle, at 17,592. Again I'm taking the August just to explain the candle over here. Initial stop loss was 17,431.
As of now, as of today, when I am over here in today session, at yesterday's close, the three candle low was 70,495.15. So I've taken a stop loss at 17,495. If, in case, by 10:15, my stop loss get triggered, today's low was right at 17,495, so as this is a recording, I've not updated the system. So right at 17,495, my stop loss got triggered. We have hit the new low. So it got triggered. And now it is trading at 17,512.
So the system got triggered right at 17,495. So I just update my system execute at 24/8 and the points or loss was around 98 points. So if I just look at the August series trade as of now again, this should be the September trade but, just to explain, I've taken it in August.
So being a closed trade, I'll just remove the trade. So as of now, since July 27th, this is in the August series trade, and if I just look at when the trending system happen, we have the first trade of the month of the series, being executed on the 27th. So it was in August series, I guess it was 28 or 29. I executed probably it may be a Tuesday or Wednesday, and I've taken a new trade into the next series.
Now, look at the momentum. When the trending happens, this system will give you a number of trades and as the trailing system goes on every hour, I'm using the trailing stop losses.
Now you may have questions like in the last 15 minutes if there is a candle, what to do? I am using it as a last three candles trailing. So the last 15 minutes candle is also considered.
Some may have a system where they don't prefer the first 15 minutes candle, and they try to prefer the 9:30 to 10:30 candle. I haven't tried that system as of now. So I may not comment on the performance of that system, but I'm using 9:15-10:15 candle. You can use that or you can try it out. You can even try 30 minutes in case you want a number of trades, or you want in an outs.
Now if I look at the average holding period of this, it's 2.73. On an average, we get somewhere around 2. Being a long weekend holiday into the August series, we have got 2.73, but generally, you get 1.8, 1.9, 2, 2.1, 2.2 average holding period. So it's around two days of average holding period a month, in this hourly trading system.
I have taken this per lot. The profits is around 38,000. So on an average, we have around 1-1.2 lakh of margin on the Nifty. On that, we are making around 38,000 as of now into the August series. So you can use the system and just keep a watch that you have a Heikin Ashi system on an hourly basis in you systems, which you can implement.
The advantage of this is that you have a fixed time. So you need not to be in the front of screen all the time. The biggest disadvantage I would say for the system is when the markets goes range bound, which I guess happened in probably June-July or July-August 2021. I guess June-July it was, where there were a number of whipsaws.
But when the August series started, we had a bang on move, which made a profit for the June and July range-bound trades. So again, this is a trending system. So rangebound will be slightly negative for you. But yes, when the trend starts, all the losses are covered, and it gives you a happy moment. All the frustrations have ended after the range bound movement.
So I hope you'll implement this system. In case you have any doubts, do comment what all doubts you have into the comment section. I'll address whatever I can. I think this strategy may be helpful for all the trader community. I hope you make profits out of the strategy.
Signing off, Brijesh Bhatia.
Warm regards,

Brijesh Bhatia
Research Analyst, Fast Profit Report
Equitymaster Agora Research Private Limited (Research Analyst)
Recent Articles
- Pyramiding PSU Bank Stocks September 22, 2023
- How to trade PSU banking stocks now.
- 5 Smallcap Stocks to Add to Your Watchlist Right Now September 12, 2023
- These smallcaps are looking good on the charts. Track them closely.
- Vodafone Idea - Can Idea Change Your Life? September 6, 2023
- What is the right way to trade Vodafone Idea?
- Repro Books Ltd: The Next Multibagger Penny Stock? August 28, 2023
- Is this the next big multibagger penny stock? Find out...
ABOUT EQUITYMASTER
Since 1996, Equitymaster has been the source for honest and credible opinions on investing in India. With solid research and in-depth analysis Equitymaster is dedicated towards making its readers- smarter, more confident and richer every day. Here's why hundreds of thousands of readers spread across more than 70 countries Trust Equitymaster.
PREMIUM PRODUCTS
QUICK LINKS
POPULAR TOPICS
- Multibagger Penny Stocks
- Basics of Value Investing
- Benjamin Graham
- How to Invest in Gold
- How to Invest in Silver
- Best Stocks to Buy Today
- Best Small-cap Stocks to Buy
- Best Bluechip Stocks to Buy
- Guide to Penny Stocks
- How to Invest in the Share Market
- Warren Buffett - The Value Investor
- Pick the Best Multibagger Stocks
TRENDING TOPICS
 Donate to credible NGOs in the sector of your choice (ii) Claim 50% tax benefit u/s 80G (iii) Receive periodic reports.")
Copyright © Equitymaster Agora Research Private Limited.
Whitelist | Refer | Terms | Privacy | Contact | About | Sitemap
Equitymaster Agora Research Private Limited (Research Analyst)
SEBI (Research Analysts) Regulations 2014, Registration No. INH000000537.
103, Regent Chambers, Above Status Restaurant, Nariman Point, Mumbai - 400 021. India.
Telephone: +91-22-61434055. Email: info@equitymaster.com. Website: www.equitymaster.com.
CIN:U74999MH2007PTC175407
Name of the Compliance & Grievance Officer: Ms Sonal Ramachandran
Telephone: +91-22-61434003 | Email: compliance@equitymaster.com
LEGAL DISCLAIMER:
Investment in securities market are subject to market risks. Read all the related documents carefully before investing.
Registration granted by SEBI and certification from NISM in no way guarantee performance of the intermediary or provide any assurance of returns to investors.
All rights reserved. Any act of copying, reproducing or distributing this newsletter whether wholly or in part, for any purpose without the permission of Equitymaster is strictly prohibited and shall be deemed to be copyright infringement.
Equitymaster Agora Research Private Limited (Research Analyst) bearing Registration No. INH000000537 (hereinafter referred as 'Equitymaster') is an independent equity research Company. Equitymaster is not an Investment Adviser. Information herein should be regarded as a resource only and should be used at one's own risk. This is not an offer to sell or solicitation to buy any securities and Equitymaster will not be liable for any losses incurred or investment(s) made or decisions taken/or not taken based on the information provided herein. Information contained herein does not constitute investment advice or a personal recommendation or take into account the particular investment objectives, financial situations, or needs of individual subscribers. Before acting on any recommendation, subscribers should consider whether it is suitable for their particular circumstances and, if necessary, seek an independent professional advice. This is not directed for access or use by anyone in a country, especially, USA, Canada or the European Union countries, where such use or access is unlawful or which may subject Equitymaster or its affiliates to any registration or licensing requirement. All content and information is provided on an 'As Is' basis by Equitymaster. Information herein is believed to be reliable but Equitymaster does not warrant its completeness or accuracy and expressly disclaims all warranties and conditions of any kind, whether express or implied. Equitymaster may hold shares in the company/ies discussed herein. As a condition to accessing Equitymaster content and website, you agree to our Terms and Conditions of Use, available here. The performance data quoted represents past performance and does not guarantee future results.
Equitymaster requests your view! Post a comment on "My Secret Nifty Trading Strategy". Click here!
Comments are moderated by Equitymaster, in accordance with the Terms of Use, and may not appear
on this article until they have been reviewed and deemed appropriate for posting.
In the meantime, you may want to share this article with your friends!