India: The Best Investment Destination

The Indian stock market benchmark indices are close to their all-time highs. But can the momentum sustain?
I believe yes, it can.
In this video, with the help of my charts, I'll show you why I think the Indian market will be a huge outperformer going forward.
Watch the video and let me know your thoughts.
Hello subscribers. Welcome to the Fast Profits Daily. I'm Brijesh Bhatia.
Nifty or Sensex is outperforming against the global markets. We have seen since August, Nifty has made a low of around 15,183, in July-August, and back towards 18,000 levels, and we are just shy of hitting the new all-time high. Probably we are around 4% away. But if I just compare it with the Dow Jones, it's much, much lower than its all-time high.
Don't Miss: Best Chance to Access Midcap Stocks Research at 80% OFF
So, yes, if you look at the global markets where we have seen a downward momentum, Nifty opening negative, reserve during the day, it and shows a positive momentum on the higher side. And that's the reason I think India is the best investment avenue or investment destination, looking at the global markets, looking at the FII and DII numbers as well.
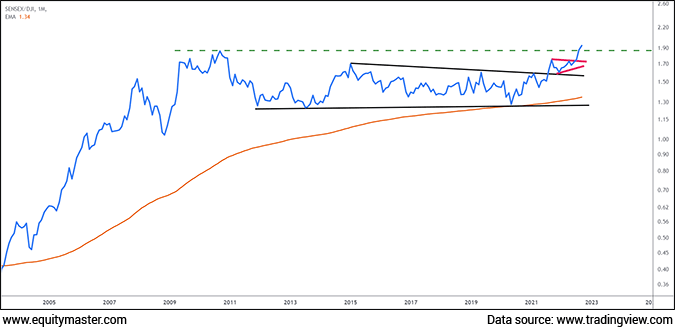
So let's start with the first chart over here. This is the Sensex to Dow Jones ratio chart.
What does this ratio chart indicate? It compares two instruments against each other and shows an outperformance or underperformance against each other. So here when their prices are going higher, it means that Sensex is outperforming against the Dow Jones and when it goes lower, it means that the Dow Jones is outperforming against the Sensex.
Now if we look right from 2009, we have seen consolidation happening after a huge rally in the global markets. 2009 to 2022, nearly 14 years, we have seen a huge consolidation coming into the structure over here.
It means that sometimes Dow Jones is outperforming, sometimes Sensex is outperforming, and then its neck to neck going on. But now in 2022, we have seen a triangle breakout coming up in the structure over here after consolidation zone. The ratio is trading at all-time high, which means that Sensex is outperforming against the Dow Jones.
If you look at the previous rally prior to the consolidation, it indicates that there is a resumption going on into this ratio chart, which means that an outperformance of Sensex over the Dow Jones has just begun or resumed the momentum or resumed the journey. And this is the monthly chart. I'm not looking for a month or two or a six months' point of view. I'm looking at next 2 to 3 years.
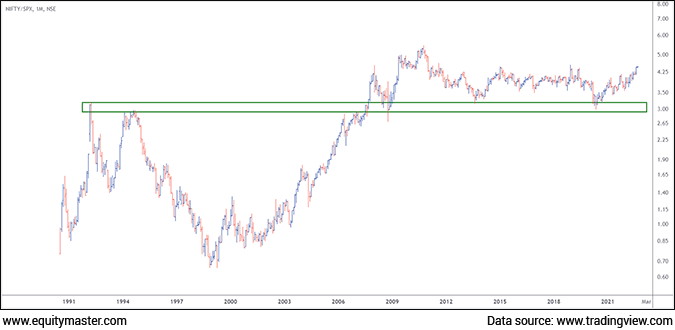
I've really Sensex is getting ready to outperform against the Dow Jones by a huge margin in coming years. If you look at the second chart over here, it is Nifty over the S&P 500.
If you look at the structure over here, it's similar. 1991 to 2000 levels, India is underperforming against the S&P 500 which means that if you look at the prices, they are falling lower which means that S&P is outperforming.
Back in 2000, posts millennium to 2008-09 when the recession happened, during this phase of around 8-9 years, India has all perform S&P by a huge margin and look at the rally it has shown. A tremendous outperformance of India over the S&P 500.
Again 2009 to 2021 probably 2nd half of 2021, as the sensex and Dow Jones chart, it was neck to neck performance sometimes S&P was outperforming and sometimes Nifty was outperforming. But now back in 2022, look at the break out happening. The base is there at around 3.2 where the marks are there. Now, if you look at the momentum, the basing has been formed over here.
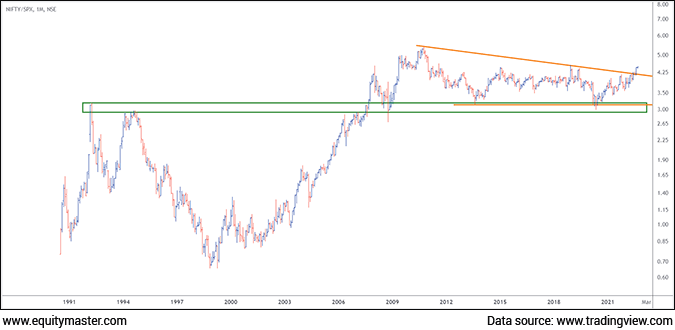
If you look at the third chart over here, after the basing, the orange line over here, the breakout has happened out of the triangle structure, which means that Nifty is ready to outperform against the S&P 500.
Again, the Sensex against the Dow, Jones and Nifty and S&P 500, the reason to take is because Sensex and Dow Jones probably have the same number of stocks. Compared to the Nifty 50, the S&P has 500 stocks, but generally the benchmarks, the trading benchmarks, are nearly same. Not the number of stocks but looking at the volume, looking at the momentum, general people follow S&P 500 largely for trading as against the Dow.
So similarly keeping this in mind, if you look at the structure, I believe yes, Nifty and Sensex will outperform against the Dow Jones and S&P 500 looking at the momentum or looking at the structure Again, I am repeating. I'm not looking for a day or two or a few months but I'm looking for years to come.
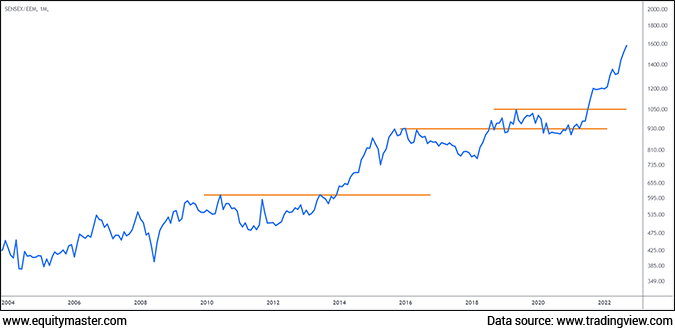
If you look at the four chart only here, this is Sensex to EEM which is the MSCI Emerging Market Index. If you look right from 2008, Sensex is outperforming the emerging markets. We have currently like somewhere around 12-13% of weightage in the emerging market index, the Indian stocks. Look at the momentum right now.
If you are an Equitymaster member and if you have attended the Equitymaster conference at the start of the year, I've highlighted in a chart that this year will belong to India against the emerging market and the same chart, it was highlighted it was trading somewhere around 1,300 and now it's trading around 1,600.
Look at the outperformance of Sensex over the EEM. So it clearly indicates that the funds are flowing into the Indian markets and Indian markets are outperforming by a huge margin over here.
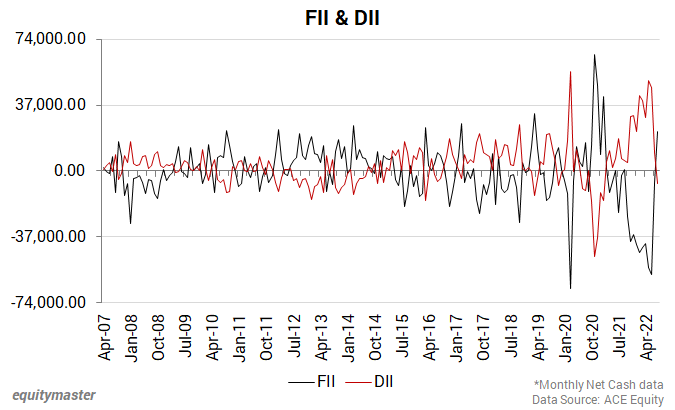
The last final chart is the FII and DII. If you look at the chart over here, whenever the Nifty forms a bottom, there is a huge selling pressure by FIIs and the bottoms are formed. If you look at 2008, 2016, I guess 6,875 was the low. In 2020 it was 7,511. Back to 2022 when the recent fall was there and the biggest spike of FIIs selling and the sharp reversal, 15,183 was the recent low.
I believe, looking at the monthly structure, looking at the price structure, and looking at the FII and DII numbers, and if you look at the recent FII and DII numbers, there is a crossover of buying of FIIs over the DIIs. So yes, the funds are moving into the Indian markets.
There could be a debate that there was a huge out flow of around 1.4-1.5 lakh crores worth of flows from the FIIs and probably I guess 30,000-35000 worth of infusion has been seen so far after the selloff. So yes, there is still room for money to come back to India. And that's there is a reason I feel that the out flow which has happened from the FIIs may come back to the Indian markets into the equities especially, and we may see the momentum coming up higher and higher.
Looking at the structure, the outperformance of Sensex over Dow Jones and Nifty over S&P 500, with the funds flowing into the markets, and FIIs coming back, I would not say that they have come back 100% but yes, this is just a beginning of FII flows, showing some of the positive number after the selling pressure, which will take India much, much higher.
Most of the companies, even if you look at the FDI, are now investing in to India and that's the reason I believe India is a great investment destination and we may see, next 2 to 3 years, the fund flow may increase into the Indian markets and India markets may see the new highs coming soon.
Signing off, Brijesh Bhatia.
Warm regards,

Brijesh Bhatia
Research Analyst, Fast Profit Report
Equitymaster Agora Research Private Limited (Research Analyst)
Recent Articles
- Pyramiding PSU Bank Stocks September 22, 2023
- How to trade PSU banking stocks now.
- 5 Smallcap Stocks to Add to Your Watchlist Right Now September 12, 2023
- These smallcaps are looking good on the charts. Track them closely.
- Vodafone Idea - Can Idea Change Your Life? September 6, 2023
- What is the right way to trade Vodafone Idea?
- Repro Books Ltd: The Next Multibagger Penny Stock? August 28, 2023
- Is this the next big multibagger penny stock? Find out...


Equitymaster requests your view! Post a comment on "India: The Best Investment Destination". Click here!
Comments are moderated by Equitymaster, in accordance with the Terms of Use, and may not appear
on this article until they have been reviewed and deemed appropriate for posting.
In the meantime, you may want to share this article with your friends!