Auto Stocks will Rise from the Ashes

Indian equities have been in a primary bullish trend for many months. I still believe the momentum is strong.
But there is a fear on the street about which stock to buy because almost all stocks have gone up.
So which set of stocks can lead the rally from now?
Well, my charts tell me that auto stocks have a good chance of outperforming.
These stocks have been underperformers for most of this year. But I think they may have bottomed out and could start moving up.
And in this video, I'll show you why.
Watch the video and let me know your thoughts in the comments. I love to hear from you.
Hello viewers. Welcome to the Fast Profits Daily. Myself Brijesh Bhatia. The markets have been on a roller coaster ride for bulls. We have seen markets now at 18,000. If you look at the Sense has now breached around 60,000 levels.
Just to cherish the memories of the web series we had on Harshad Mehta 1992, the highs of Harshad Mehta was around 4,500 and in last three decades, we are from 4,500 to now 60,000 levels more than 13x on the Sensex.
So it has been a primary bull trend for Indian equities and we still believe the momentum is strong. But yes, still there is a fear on the street that what should you buy? What should you miss out? Which stock can rally?
We have been discussing various sectors in our Fast Profits Daily video series. We have discussed metals, power, energy, sugar, a lot of sectors are being discussing for quite long now, but one sector in today's video we will be discussing has been underperforming in the recent rally for last 6 months.
Since February or start of 2021, Nifty has been ruling with the hands of IT stocks, Reliance, a few banking stocks I would say. The rally has been stupendously positive.
So one sector where we think which is underperforming and can rise from the ashes is the auto index. So let's to get the first chart why I'm saying that the underperformance of auto index could be come to an end.

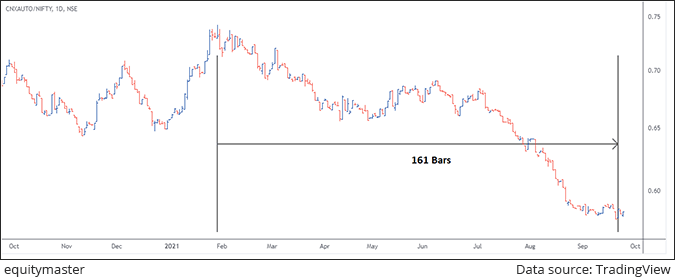
The first chart is a ratio chart, auto index to Nifty. What I've done is I have taken auto index price and divided with the Nifty price to look at the ratio over here. So when the ratio goes higher, it means that auto index is outperforming. When the ratio goes lower, it means that Nifty is outperforming.
So if you look at the highs February over here, to the lows, it's continuously on a downtrend in momentum, and it means that nifty was outperforming since the highs of February 2021. So nearly 6-7 months now, this index is underperforming.
But if you look at the key time cycle over here, the fall since February to September has taken exactly 161 days and 161 being a golden ratio of the Fibonacci levels. When this time cycle ends and markets tend to reverse or the instrument tends to reverse, it indicates that there could be a short term bottom in place.
I believe if this ratio chart low is being held, the auto index could start outperforming against the Nifty. I'm not saying that Nifty will fall over here. I'm just saying that auto index will outperform against the Nifty which was not the case in the recent scenario for the last six months.
IT has been outperforming against the Nifty. If you look at a few energy stocks, they have been outperforming against the Nifty. Power stocks have been outperforming against the Nifty. Real estate in the last couple of weeks have been outperforming against the Nifty.
So I believe now that Auto Index could see the turning of the tide and rise from the ashes and probably next 2-3 months, one should definitely look for auto index as a huge positive momentum.
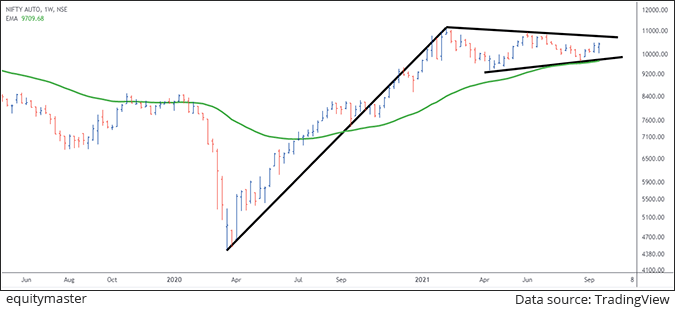
Let's look at the auto index chart over here. So first, I am looking at the weekly chart over here which is a slightly larger time frame.

If look at this rally from 2020-2021, so March 2020 lows to 2021 high, it has been as straight uptick momentum. Since then, it went into consolidation in the form of symmetrical triangle. So basically symmetrical triangle is where the range consolidates and it forms lower highs and higher lows.
If you look at the whole structure over here from the 2020 lows to the highs, and then a consolidation, and it forms of bullish pennant over here. Still, the breakout is not yet done. So it on cards, the breakout level is somewhere around 10,850. So I'm just taking a rough 11,000 as a psychological level.
Above 11,000, the bullish momentum of would continue on a big win auto index if you look at the weekly chart and that's the bullish pennant break out on the charts.

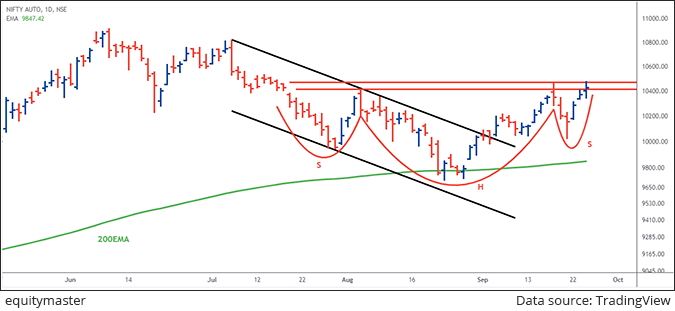
If I look at the second, I will slightly go on to the lower time frame over here look at the daily chart over here. Two-three important things. First, if you look, the bullish head and shoulder is forming and the neckline is placed somewhere around 10,450. Let's look at 10,500 considering slight cushion over here.
Any move above 10,500, this breakout is happening of the bullish head and shoulder. If you look at the low, it was somewhere around 9,800. So if I just look at the height from neckline to the head, its somewhere around 600 points. If I just add up to 10,500 we are getting over 11,000 levels, which will automatically be of break out on the weekly chart pennant.
Second important thing. If you look at the green line which is 200 days exponential moving average, it is termed as the long term moving average, and it has been retested around those levels, consolidated and now moving higher, which means that the support is being placed very, very strongly. So here again, we are taking support of 200 days average and moving higher.
Third, if you look at the black channel over here, the falling channel, the prices were consolidating in the falling channel. Once it broke out, again, it went to higher level. Now at higher level, it has been consolidating at the form of the neckline for head and shoulder, a bullish head and shoulder I would say.
So yes, again, the setup is very, very strong on the weekly, on the daily, as well as the ratio chart. It is indicating that the outperformance could start and end of an underperformance could happen for auto index against the Nifty.
So that's one sector you should definitely keep in mind from a trading per se for 2 to 3 months as well and I believe once 11,000 is crossed on the auto index, there is a big wave to come for the auto index. Even if you're a short term trader, 10,500, if it's taken out, look for a strong, strong upside momentum.
Now on the stock said yes, there could be a debate where we are witnessing some EV plays coming into the auto space. Two-wheelers have been slightly underperforming because there's the competition is higher against the electric vehicles on the scooters and two-wheelers.
So it should definitely look at the stocks where you think that the momentum could be very, very strong, and then stock selection will be very important into the auto space. So signing off, Brijesh Bhatia. Thank you.
Warm regards,

Brijesh Bhatia
Research Analyst, Fast Profit Report
Equitymaster Agora Research Private Limited (Research Analyst)
Recent Articles
- Pyramiding PSU Bank Stocks September 22, 2023
- How to trade PSU banking stocks now.
- 5 Smallcap Stocks to Add to Your Watchlist Right Now September 12, 2023
- These smallcaps are looking good on the charts. Track them closely.
- Vodafone Idea - Can Idea Change Your Life? September 6, 2023
- What is the right way to trade Vodafone Idea?
- Repro Books Ltd: The Next Multibagger Penny Stock? August 28, 2023
- Is this the next big multibagger penny stock? Find out...


Equitymaster requests your view! Post a comment on "Auto Stocks will Rise from the Ashes". Click here!
Comments are moderated by Equitymaster, in accordance with the Terms of Use, and may not appear
on this article until they have been reviewed and deemed appropriate for posting.
In the meantime, you may want to share this article with your friends!