How the Nifty Will Move in October

September was a great month for the bulls in the stock market.
But what about October?
Will the markets soar higher or will we see a correction? Will the Nifty get to 18,000 or fall to 17,000?
In this video, I'll dive deep into my technical charts to find the answers for you.
Watch the video and let me know your thoughts in the comments. I love to hear from you.
Hello viewers. Welcome to the Fast Profits Daily. Myself, Brijesh Bhatia.
If you look at the September series and August series, markets have been on a stellar move. After two months of consolidation in June and July, August was a super-duper break out, or I would say a range expansion, Bollinger band expansion, and we see around 8% gain in August, followed by around 3% gain in September and what in the box for October?
Well, if you look at the sectorial change or sector rotations, it has been very, very frequent in last couple of months and a couple of weeks back, I have done a video on Fast Profits Daily in this YouTube channel, saying that Why I'm Bullish on Power Stocks. If you look at last one week, power has been on a roll and if you look at the momentum, it's still on the bullish side.
So what to look on the Nifty in the month of October?
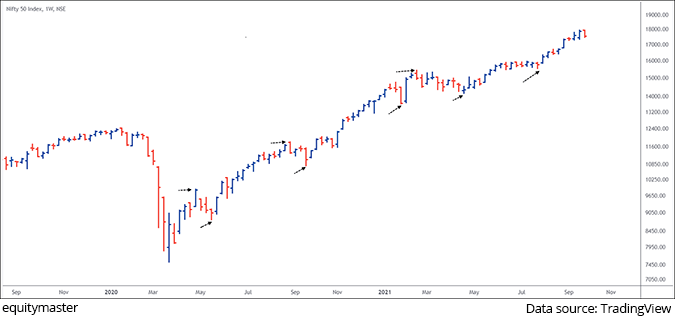
We all know that markets are roaring into a bullish momentum and if you look at the first chart over here, the weekly chart, the price or index is forming higher high and higher low structure and as per the dow theory it is termed to be a bullish structure. So yes, weekly is very, very bullish as of now with a higher high and higher low structure.
Moving on to the daily chart over here.
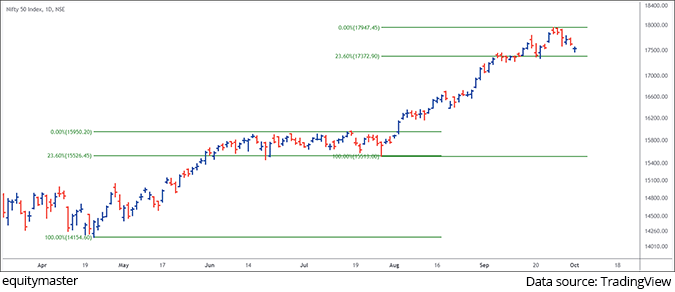
If you look at it, the momentum over here and if the history repeats, the consolidation of June and July was around 23.6% Fibonacci retracement of the previous rally.
Since they break out in August, the rally and the recent dip has been again at 23.6% retracement. So if I just look at the momentum over here, the history is repeating with 23.6% retracement.
Again, if you see there on Friday, first day of your October series, the new series, we started with negative bias, with a gap down and the 23.6% support has been held very, very strongly again.
So I believe till this level is holding, the recent low on 23.6%, I think the trend is still strongly bullish over here. So what's to be expected? 18,000 in the current October series? I probably think, yes, we can.
We just went down to slightly lower timeframe to analyse what is the very short momentum picking up. So we went on to the two-hour charts.
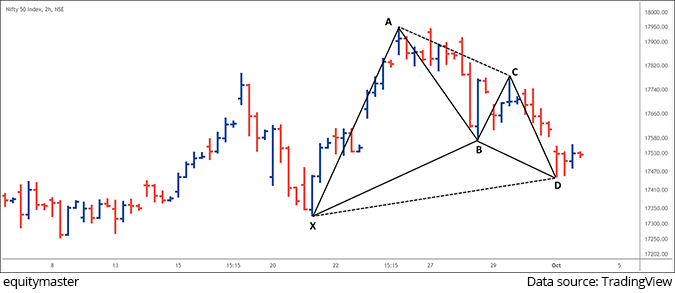
So if you look at the first two-hour chart over here, this is the bullish Gartley Harmonic Pattern. The recent low of around 17,452, it has reversed from right from the reversal zone of bullish gartley, which was around a 17,445-17,462 band. We made a low of around 17,452 and we have seen back towards 17,550 levels.
I think this low is held or probably the previous swing low of 17,326, taking just a round off 17,300, if these levels are holding, we are expecting the October series to be bang-bang on the positive side, and bulls can take it to 18,000 levels.
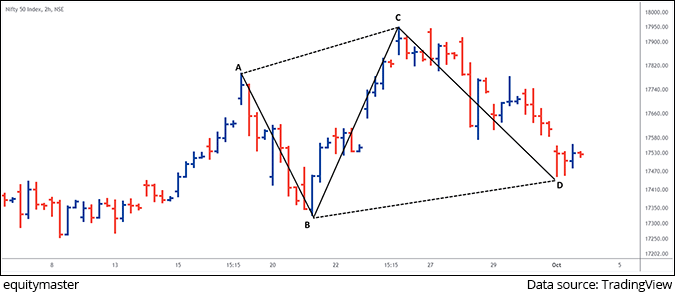
The same two-hour chart, the similar pattern. Again, this is a reciprocal AB=CD, which is again an harmonic reversal pattern, and this patterns are forming after a retracement from the higher level of 17,947 back towards 17,452 and the bullish structure has been forming.
So I believe, till these levels are holding, markets will continue to roar higher and higher. So for the October series, just look at these levels. 17,300 is the I would say the negating level for the momentum and probably the higher side could be expected.
What could go wrong or what is the risk over here? Again, the first and foremost risk is the dollar index (DXY). So let's look at the chart of the dollar index over here.
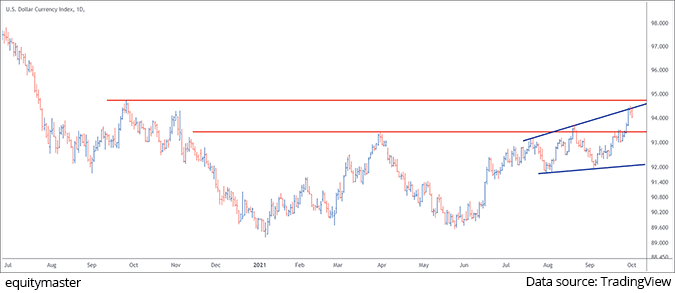
Yes, the lower red line has been taken out but if you look at the upper line, the redline, it is yet to be taken out, which is somewhere around 95 levels and till these levels are not crossed, I think for dollar index it's a stiff resistance.
Plus, if I just took at the right side of the blue lines over year, this is a broadening wedge. The index is reversing right from the broadening wedge, which is a higher level of around 94.50-94.60 and I think this will act as a major resistance zone. If dollar index moves over 95.20-95.30, then there could be the risk for the Nifty.
If this broadening wedge plays out very, very well, then are expecting that the dollar and they could fall back towards 88-88.5 level on the downside. So keep a watch on this dollar index very, very closely as of now and the future momentum could be dependent on the dollar index as of now.
I have also done a video on dollar index versus Nifty, the correlation of them. In case you haven't watched it, you can also watch in our archives or in our previous videos. You can find other relation of dollar index versus Nifty and you can judge these moves. I have also explained the charts of both of them, keeping them side by side.
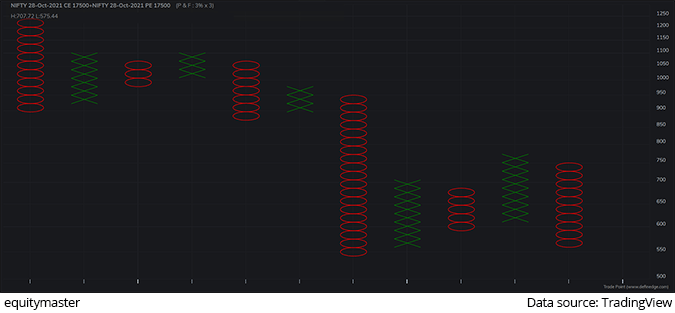
Second over here, I would say, this is the straddle chart of 17,500, the monthly expiry, the October monthly expiry. This red anchor column is there on the chart. This is 3% by 3 chart. If in case this straddle value falls below 500, probably we might see that the October month might go into the range bound. Probably we can see between 17 and 18 for quite long.
If, in case, it doesn't break 500, the volatility can be expected, and we could see 18,000, above 18,000 levels or below 17,000 but our bias is 18,000 can be expected on Nifty. So you should watch this straddle value very, very closely. Below 500 that could be a sign that at the October series might go into the range bound.
Even if you remember the daily chart, which we showed around 23.6%, if you look at the history, it retraced around 23.6% and went into slight consolidation and that could be also the possibility for Nifty.
But as of now, looking at the momentum, I believe that the momentum could be towards 18,000 for the markets, and this 500 straddle value will be very, very crucial to look out. Probably this week, we might give a quite a confirmation of about this straddle value.
So signing off. In case you're liking our videos and in case our sectoral videos or any of the Fast Profits Daily videos, are helping you, click on the subscribe button and don't forget to press the bell icon so that you receive the notification as soon as we release the video.
Also, it would be helpful in case you comment what are your feedbacks on our video and in case you think that some of the topics we should cover in our video, we will be happy to entertain those comments.
Signing off. Brijesh Bhatia.
Warm regards,

Brijesh Bhatia
Research Analyst, Fast Profit Report
Equitymaster Agora Research Private Limited (Research Analyst)
Recent Articles
- Pyramiding PSU Bank Stocks September 22, 2023
- How to trade PSU banking stocks now.
- 5 Smallcap Stocks to Add to Your Watchlist Right Now September 12, 2023
- These smallcaps are looking good on the charts. Track them closely.
- Vodafone Idea - Can Idea Change Your Life? September 6, 2023
- What is the right way to trade Vodafone Idea?
- Repro Books Ltd: The Next Multibagger Penny Stock? August 28, 2023
- Is this the next big multibagger penny stock? Find out...


Equitymaster requests your view! Post a comment on "How the Nifty Will Move in October". Click here!
Comments are moderated by Equitymaster, in accordance with the Terms of Use, and may not appear
on this article until they have been reviewed and deemed appropriate for posting.
In the meantime, you may want to share this article with your friends!