
Stocks You Didn't Think About Trading

In this video I'll share a new trading opportunity with you.
You don't usually hear about these stocks, indeed this sector, too much on CNBC.
Some traders consider them to be boring. Well, they are mistaken.
Today, I'll show you how to trade this overlooked sector using a chart that I'm sure you haven't seen before.
Let me know your thoughts about this video. I would love to hear from you.
Hello viewers. Welcome to the Fast Profits Daily. Myself Brijesh Bhatia.
The markets, I would say especially the midcaps in the last one week, has been outperforming hugely against in Nifty and this sector rotation has been very, very frequent.
If you remember, we initiated a video on power stocks and we have seen power in last couple of weeks.
Special Anniversary Offer: Vanishing Tomorrow - Your Chance to Save 80%
Then we all come came up with auto as well and now the autos has been outperforming and we highlighted why will auto outperform against a Nifty? Because it was indicating that the bottom formation is there on the ratio chart of auto versus the Nifty and we have seen the autos coming back very, very strongly. I think this is not an end for auto. It is just a start of an outperformance against the Nifty for this auto space.
But in this video, we are not here to discuss about auto, but one sector where we think a potential bullish momentum can be expected. It's the gas distribution stocks.
We have created an equal weighted gas distribution stocks with the marketcap of 10,000 crores minimum. The stocks which are above marketcap over 10,000 crores, we have taken into consideration. So if you look at it stock wise, Adani Total Gas, IGL, MGL, GAIL, and Gujarat Gas were the 5 stocks, which has a marketcap above 10,000 crores.
But before that, let's look at what the gas distribution index weekly chart is a showing on before we move on to the most interesting chart, which I look it as a time cycle or the moon face cycle. Let's look at the weekly chart first.
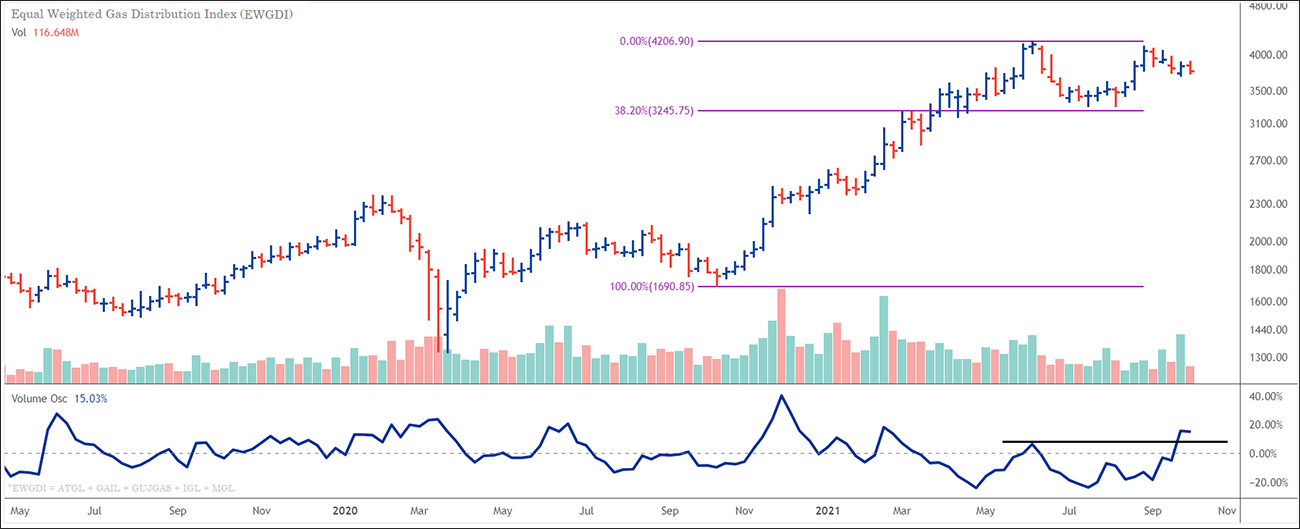
So, if you look at the weekly chart over here, we have seen a huge rally coming between September to the May 2021. So September 2020 to May 2021. This equal weighted gas distribution index has shown a stellar rally.
It slightly dipped down side and it took support right at 38.2% Fibonacci retracement. When the Fibonacci retracement play a key support zone, it tends to act as a major momentum lows. Now we have seen after that, prices going higher. Now again it's consolidating in a form of, I would say, in a narrow range weeks for quite some time.
But if you look at the volumes over there, the last to last week, volumes has been uptick, while the last week the markets where, the index was likely in a narrow range, the volumes has been slightly lower.
If you look at the lower panel, which is the volume oscillator, so I have taken, so generally the default period which volume oscillator is selected people take is 25. I've taken 14 and 5 being a fast moving average and 14 being a slow moving average. So the volume oscillator what it does, is it calculates comparing to averages, and it brought the line over here.
Look if you look at the volume oscillator line over here, it is giving a positive bias. Now it is again trading above the integer line or zero line, somewhere around 15, and it has broken the previous highs as well.
It indicates that the strength for bulls is still there into the trend, and we might see a positive move coming up ahead.
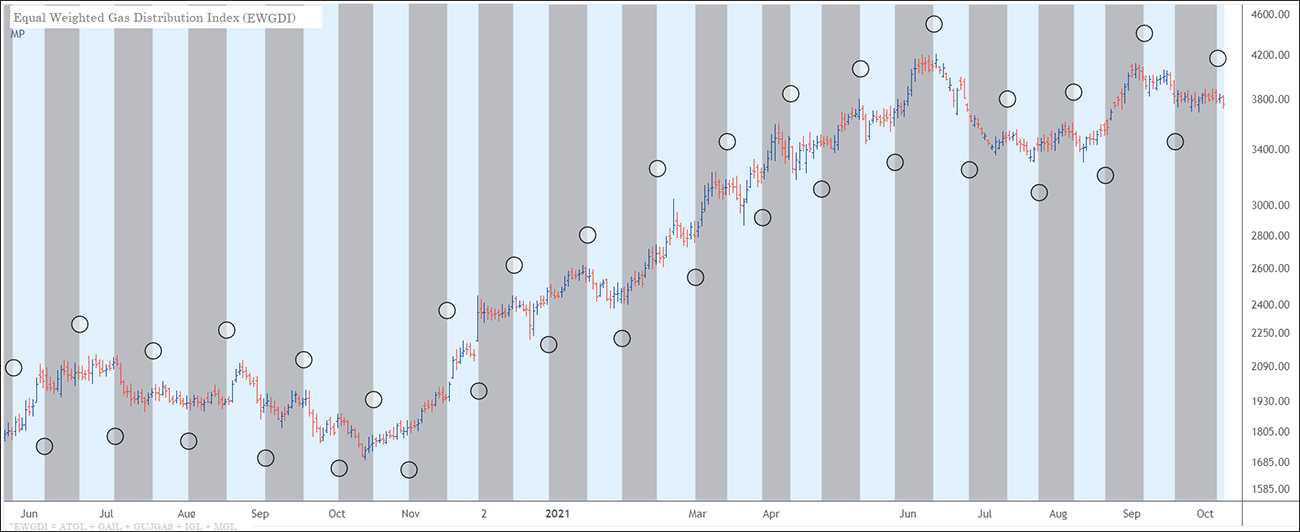
The second chart I want to discuss is the most important, it's the moon face chart. So if you look at the moon face chart over here, basically the moon face is the 14 period 14.5 period, it's generally known as from the full moon to the new moon, Amavasya or Poonam is there.
If you look at the historical, this is playing very, very strong. If you look at the waning and waxing, generally when the lagging period happens and when the new cycle starts, when it's waxing, the momentum builds up.
If you look at the previous period, which was a range bound period, I am expecting that the momentum could be expected in the current period, which is the next 14 days period and which might I think it's ending by around next Monday, Tuesday, and we might see this momentum playing out, and this could be again a start of the fresh momentum and which could last for another 3 to 5 weeks on the volatility side.
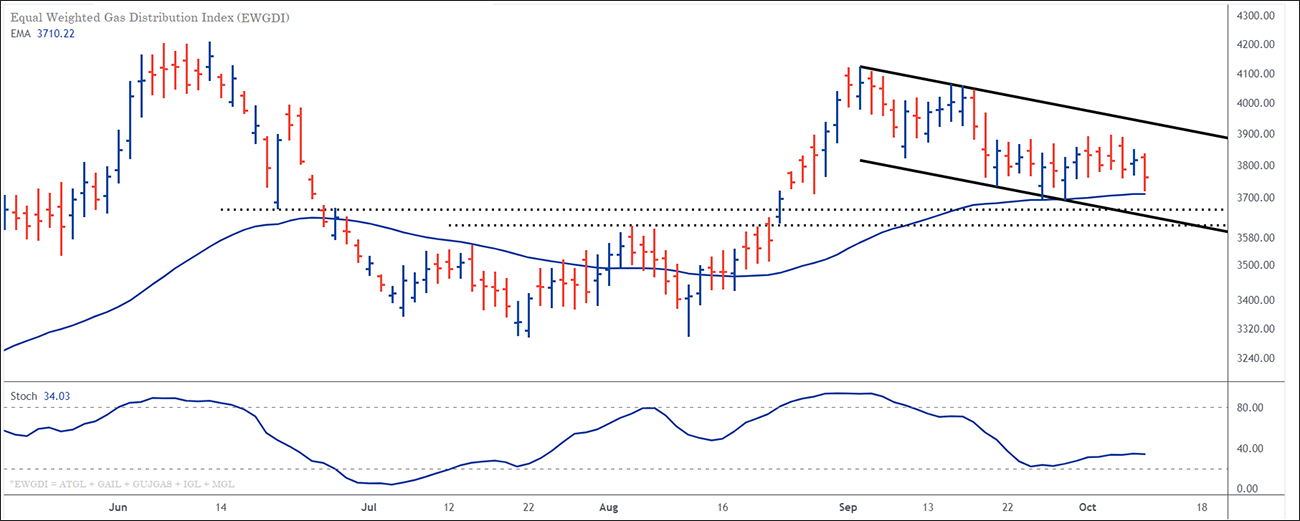
Now where would this momentum lead to? So if we look at the daily chart over here, the momentum is very, very strong over here, and if I just look at the some of the support lines, if you look at the dotted lines, the black dotted lines, it is acting as a support.
It is also trading in a falling channel formation, and basically the falling channel is a sign of a consolidation after the rally.
Now the most important point is, if you look at the 50 days average, prices are taking support at the 50 days average. Again, this is an equal weighted gas distribution index, which is taking it support and so, if you look at the border stocks wise, they are taking support at the 50 days average and it is very, very much important over here.
So the prices are at major support indication and if you look at the lower panel, the stochastics, I've taken a 14 period stochastics because I want to play for 3 to 5 weeks' momentum. I'm not looking for a one day or two days, or one week momentum. So I've taken a 14 period stochastic. So if you look at it, the slope is turning upward from the lower levels.
So again, it is a sign of bullish bias over here for me with the moon cycle indicating that the momentum can be on the cards. The daily chart and the weekly charts which are indicating that the trend is still bullish, we can expect the bullish bias here when the moon phase is indicating the momentum is on the cards.
So I think one should definitely look for a next 3 to 5 weeks on this gas distribution index. I am expecting that this gas distribution index can go up by around 12 to 15% in next five, probably 5-7 weeks, and we might see momentum coming up very, very strongly from the bulls.
I think it should not miss this pure momentum play in these gas distribution stocks.
So signing off. Brijesh Bhatia.
Warm regards,

Brijesh Bhatia
Research Analyst, Fast Profit Report
Equitymaster Agora Research Private Limited (Research Analyst)
Recent Articles
- Pyramiding PSU Bank Stocks September 22, 2023
- How to trade PSU banking stocks now.
- 5 Smallcap Stocks to Add to Your Watchlist Right Now September 12, 2023
- These smallcaps are looking good on the charts. Track them closely.
- Vodafone Idea - Can Idea Change Your Life? September 6, 2023
- What is the right way to trade Vodafone Idea?
- Repro Books Ltd: The Next Multibagger Penny Stock? August 28, 2023
- Is this the next big multibagger penny stock? Find out...
ABOUT EQUITYMASTER
Since 1996, Equitymaster has been the source for honest and credible opinions on investing in India. With solid research and in-depth analysis Equitymaster is dedicated towards making its readers- smarter, more confident and richer every day. Here's why hundreds of thousands of readers spread across more than 70 countries Trust Equitymaster.
PREMIUM PRODUCTS
QUICK LINKS
POPULAR TOPICS
- Multibagger Penny Stocks
- Basics of Value Investing
- Benjamin Graham
- How to Invest in Gold
- How to Invest in Silver
- Best Stocks to Buy Today
- Best Small-cap Stocks to Buy
- Best Bluechip Stocks to Buy
- Guide to Penny Stocks
- How to Invest in the Share Market
- Warren Buffett - The Value Investor
- Pick the Best Multibagger Stocks
TRENDING TOPICS
 Donate to credible NGOs in the sector of your choice (ii) Claim 50% tax benefit u/s 80G (iii) Receive periodic reports.")
Copyright © Equitymaster Agora Research Private Limited.
Whitelist | Refer | Terms | Privacy | Contact | About | Sitemap
Equitymaster Agora Research Private Limited (Research Analyst)
SEBI (Research Analysts) Regulations 2014, Registration No. INH000000537.
103, Regent Chambers, Above Status Restaurant, Nariman Point, Mumbai - 400 021. India.
Telephone: +91-22-61434055. Email: info@equitymaster.com. Website: www.equitymaster.com.
CIN:U74999MH2007PTC175407
Name of the Compliance & Grievance Officer: Ms Sonal Ramachandran
Telephone: +91-22-61434003 | Email: compliance@equitymaster.com
LEGAL DISCLAIMER:
Investment in securities market are subject to market risks. Read all the related documents carefully before investing.
Registration granted by SEBI and certification from NISM in no way guarantee performance of the intermediary or provide any assurance of returns to investors.
All rights reserved. Any act of copying, reproducing or distributing this newsletter whether wholly or in part, for any purpose without the permission of Equitymaster is strictly prohibited and shall be deemed to be copyright infringement.
Equitymaster Agora Research Private Limited (Research Analyst) bearing Registration No. INH000000537 (hereinafter referred as 'Equitymaster') is an independent equity research Company. Equitymaster is not an Investment Adviser. Information herein should be regarded as a resource only and should be used at one's own risk. This is not an offer to sell or solicitation to buy any securities and Equitymaster will not be liable for any losses incurred or investment(s) made or decisions taken/or not taken based on the information provided herein. Information contained herein does not constitute investment advice or a personal recommendation or take into account the particular investment objectives, financial situations, or needs of individual subscribers. Before acting on any recommendation, subscribers should consider whether it is suitable for their particular circumstances and, if necessary, seek an independent professional advice. This is not directed for access or use by anyone in a country, especially, USA, Canada or the European Union countries, where such use or access is unlawful or which may subject Equitymaster or its affiliates to any registration or licensing requirement. All content and information is provided on an 'As Is' basis by Equitymaster. Information herein is believed to be reliable but Equitymaster does not warrant its completeness or accuracy and expressly disclaims all warranties and conditions of any kind, whether express or implied. Equitymaster may hold shares in the company/ies discussed herein. As a condition to accessing Equitymaster content and website, you agree to our Terms and Conditions of Use, available here. The performance data quoted represents past performance and does not guarantee future results.
Equitymaster requests your view! Post a comment on "Stocks You Didn't Think About Trading". Click here!
Comments are moderated by Equitymaster, in accordance with the Terms of Use, and may not appear
on this article until they have been reviewed and deemed appropriate for posting.
In the meantime, you may want to share this article with your friends!