How to Pick Stocks for Intraday Trading

This year many new traders have entered the market. Many of them have started intraday trading.
However, they seem to be going about it without any trading system. Even if they are following a system it may not be a good one.
So in this video, I'll share the system I use for intraday trading. It's a proven system which should serve the needs of any intraday trader.
Watch the video and let me know your thoughts. I would love to hear from you.
Hello viewers. Welcome to the Fast Profits Daily. Myself, Brijesh Bhatia.
Considering the volatility and the markets trading at all-time highs, it is attracting any number of traders, especially the intraday traders. We are looking at these stocks, which are giving 5%, 10% moves or 3% moves on an intraday basis and people are, it's fascinating, to enter into markets on intraday basis.
Don't Miss: Best Chance to Access Midcap Stocks Research at 80% OFF
Well, I have read a book by Prashant Shah, the name of the book is, Trading the Markets The Point & Figure Way and one pattern has really excited me from his book is called Super Pattern on Point and Figure chart.

This video is not promoting any book or any software, but one should definitely read his book if you are interested in technical analysis be it intraday be it momentum trading, be it positional trading, be it investing through technical analysis. His book is definitely eye opening for you all.
So one pattern, which has excited me on trading intraday and selecting the stocks, and this pattern is called Super Pattern. So let's understand what this Super Pattern is first.
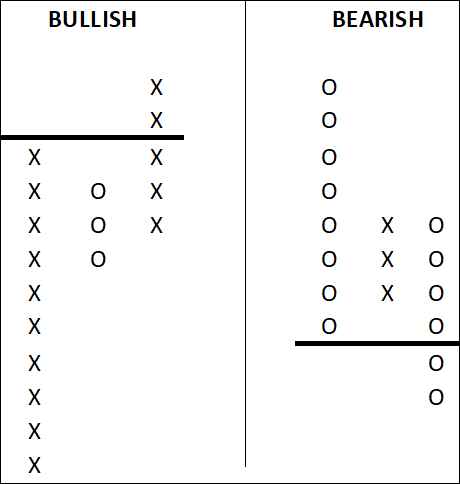
So if you look at this the left is the bullish and the right is the bearish. So when the column of Xs, it's basically the bullish momentum. So when the rising X is there it means that the stock prices are going higher and higher.
The series of Os over here generally is that the prices are falling. Now that parameter might differ from analyst to analyst or the trader to trader who are using it.
Similarly, if you located third column of X over here, a series of X followed by O, and followed by X again. So when the high of X is taken out after a dip or replacement or I would say a consolidation after a rally, and then again momentum breaks out.
So if you are a traditional trader who are looking for bar charts or candlesticks, it's basically a flag breakout or a pennant breakout. So here, after a rally, when consolidation happens and the highs are taken out, it comes as a Super Pattern.
Similarly, on the bearish side, a series of Os, a couple of or 2 to 3 Xs over here in the form of consolidation of retracement, and the fall of selling pressure over here, followed by O. So when the previous lows are taken out, it gives a confirmation that the Super Pattern has broken down.
So in the intraday stock selection process, what I'm using is 0.15% by three on daily chart. So at the end of the day, every end of the day, I will scan these stocks, and I'll show you this scanner as well, what software I'm using. At the end of day, I'll scan the stocks and whatever stocks I'll find in the parameter, again, it's a bias, whatever selection you want to do on the stock basis, whatever basket you want, and enter into a trade. So I'll show you my scanner and what stocks my scanner has thrown out, and how the move has been.
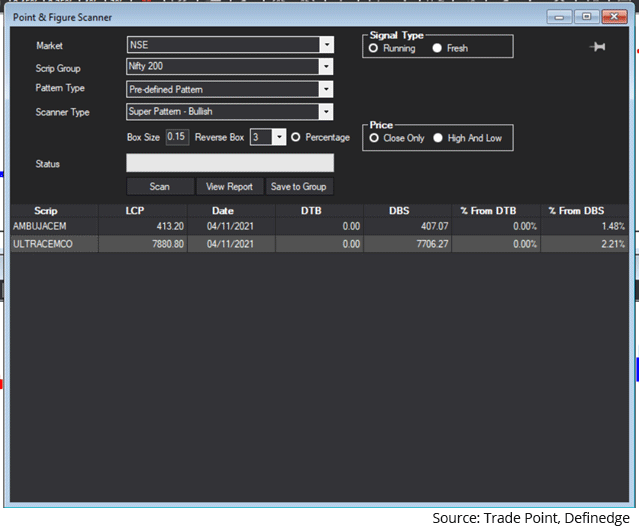
So let's look at the first the scanner over here. This is a bullish scanner. Again. 0.15% by three on the daily chart. So I got two stocks based on the closing of fourth of November, which was Thursday. Friday, Saturday, and Sunday being off. So I got two stocks based on the scanner, 0.15% by 3 daily. I got two stocks, Ambuja Cement and Ultratech Cement.
Whatever stock selection you do, whatever stock bias you have, you can trade those stocks. So let's look at how this has performed on Monday. Friday, Saturday, Sunday was off. So eighth of November, which was yesterday, how it has performed. Look at the momentum.
I am buying right at the opening of the stock. I repeat. I am buying right at the opening of the stock. I'll explain to you what the stop loss system I'm using and what the trailing SL I'm using.
So, I bought at 9:15 at open or round 9:16 and what I'm doing is I am keeping of 15 minutes bar chart over here. I'm not using the point & figure chart over here.
For a stop loss, what I'm doing is I am taking a bar chart on 15 minutes, and I will take three previous bar lows as a stop loss. I repeat. If I am buying on 9:15 my three bar low stop loss of the previous day, which is 3:15-3:30, 3-3:15, and 2:45-3. So between 2:45 to 3:30, whatever was the lowest low, I will keep a stop loss at that level when I'm entering a trade.
I am repeating. The stop loss is previous three candles of previous three lows of 15 minute bar. So when I'm entering a trade, my lowest low of 2:45 PM to 3:30 PM will be my initial stop loss. As soon as 15 minutes bar goes up, I will trail my stop losses to previous three lows again over here.
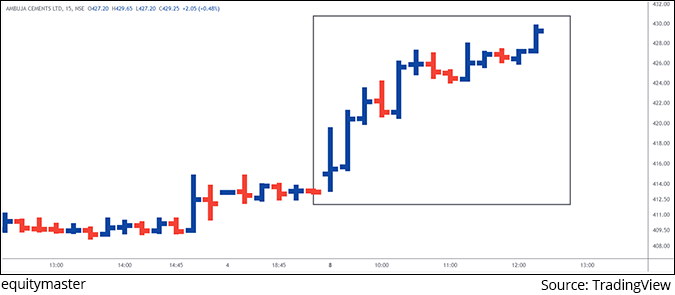
So if you look at the chart over here, Ambuja Cement chart, by the time I was shooting the video at 12:30 PM yesterday, it haven't had hit the stop loss and it was continuing on the positive momentum. So I got a trade somewhere at the opening of around 215 and by 12:30 PM when I was shooting, it was somewhere around to 229. So again if you look at the momentum, it was very, very strong.
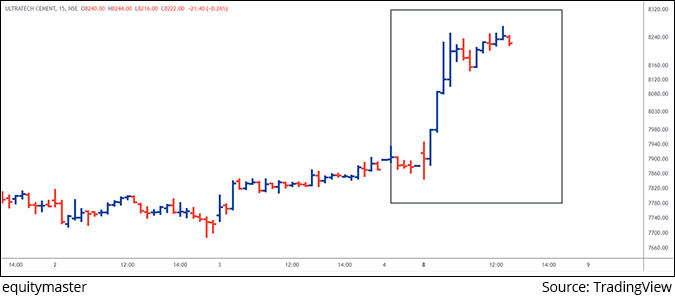
Look at the second, Ultratech Cement, which was from the scanner. Again the similar structure. Bought at open. It went on to the higher and higher levels.

Look at the bearish scanner over here. The only stock which I got in the bearish. I am taking Nifty 200 as a basket initially. You can think whatever. Nifty 500, F&O stocks midcap stocks, largecap stocks, Nifty 50. What everyone? What I've done, I taken Nifty 200 and I got a stock ICICI Bank has a short sell.
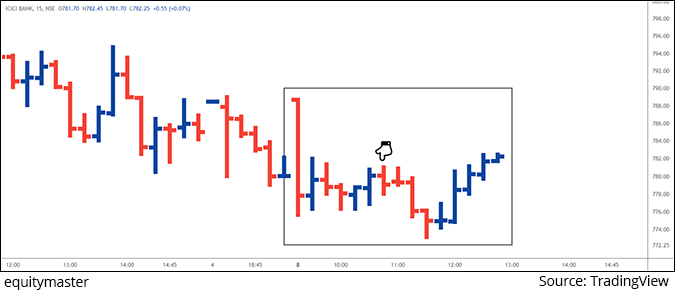
At 950, I went short. Again it opened higher at around 980-989 and I got a short at somewhere around 983 because it was a gap up opening and again the first couple of ticks. So I am not taking it as a high. The entry, which I got was around 983-983.5.
I kept the high as a stop loss, the previous three bars. Again, in this case, it was the highest level of around intraday high and I trailed down, trailed down, trailed down. It went to the low but in the end, if you look at the arrow mark over there, it hit my stop loss somewhere around 980. So still, I was making money of around three points.
If you want to use this, the same parameters of three highs and on a short side, stop loss on a 15 minute chart, on the long side, he can use three lows. Even you can try the same system if you want intraday stocks coming up in front of you.
This is a software called Tradepoint which I have taken trades from and they have this scanner available. So, in case you want to take a try, again, we are not promoting any software over here but you can't get in touch with them if you want to try this software.
Again, as I said, the same thrilling system is being used and sometime it might happen that in case you want intraday stocks should come of in front of you, you can try the same 0.15 system by three, on 30 minutes.
So I am not hardcore intraday frequent trader but can definitely try this but I have been tracking this system for last six months which I have shown.
At end of the day, I got a stock list, I tried it out and again, the reason and showing this current trades is because the trades which were released, scanned was on Thursday and how it had performed in yesterday's session on Monday, just a day before you're watching the video. So that's the reason I've taken the live trades in front of you so that you get an idea.
Definitely, I suggest you track these trades. You will definitely look for a better intraday trading system.
That's the way I do my stock selection for intraday trading.
Signing off. Brijesh Bhatia.
Warm regards,

Brijesh Bhatia
Research Analyst, Fast Profit Report
Equitymaster Agora Research Private Limited (Research Analyst)
Recent Articles
- Pyramiding PSU Bank Stocks September 22, 2023
- How to trade PSU banking stocks now.
- 5 Smallcap Stocks to Add to Your Watchlist Right Now September 12, 2023
- These smallcaps are looking good on the charts. Track them closely.
- Vodafone Idea - Can Idea Change Your Life? September 6, 2023
- What is the right way to trade Vodafone Idea?
- Repro Books Ltd: The Next Multibagger Penny Stock? August 28, 2023
- Is this the next big multibagger penny stock? Find out...


Equitymaster requests your view! Post a comment on "How to Pick Stocks for Intraday Trading". Click here!
Comments are moderated by Equitymaster, in accordance with the Terms of Use, and may not appear
on this article until they have been reviewed and deemed appropriate for posting.
In the meantime, you may want to share this article with your friends!