How to Find the Best Sector for Trading

I have made many videos on various sectors and how to trade them.
But I have not done a video of how I find those sectors using charts.
That's what I'll cover today.
In this video, I'll show you my 3-step process to find the best sector for trading.
Watch the video and let me know your thoughts.
Hello viewers. Welcome to the Fast Profits Daily. Myself, Brijesh Bhatia.
In this video, I will show you how to find the best sector for trading using technical analysis.
Well, I use three approaches to choose the sector which will be a good momentum for trading or investing.
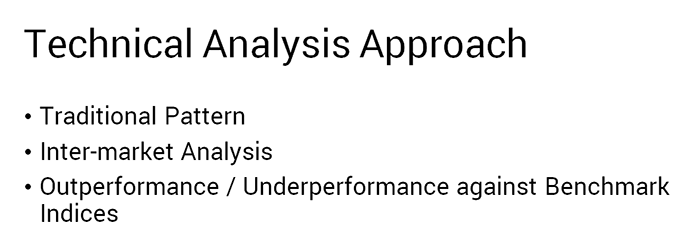
So first is a traditional pattern or a modern patter or whatever you are using, be it Elliot Wave, harmonics, candlesticks, trendline breakout, channel breakout, whatever kind of basic stuff or technical analysis patter you follow, will be under the first step.
Must See: Do You Invest in Midcap Stocks? Here's a Great News for You
Second is the inter market analysis, which depends on commodities, currencies, and third is the out performance or underperformance against the benchmark indices. The third approach is very, very important and why, I'll show you.
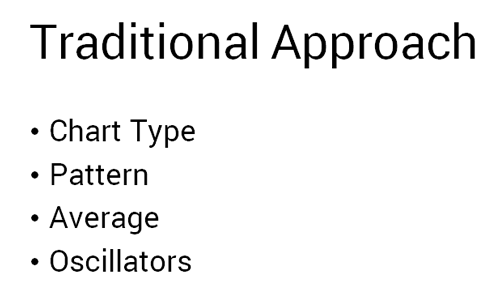
So let's look at the first, what is covered in the first, the traditional. As I said you choose the chart type be it the bar chart, candle sticks, point and figure, Kagi, Heikin Ashi, there are a number of various types of charts.
Patterns? There are a number of patterns. Head and shoulders breakout on the sectoral chart, channel breakout on the sectoral chart, and there could be Elliot Wave theory, whatever harmonic, whatever you're using.
Averages? Some people play with moving averages. When the sectoral indices move above the 200 days exponential moving average, which is the long term average, they tend to buy. Some prefer Golden Cross over, which is about the 50 crossing over the 200 days average, they go long. Some prefer three moving averages where the short, medium, and long term averages are there, and the sector moves above the averages, they prefer to invest.
Again the forth is oscillators being the RSI and MACD. I have discussed some of the strategies for investing. So in case you missed that, you can go to our archives and watch our videos.
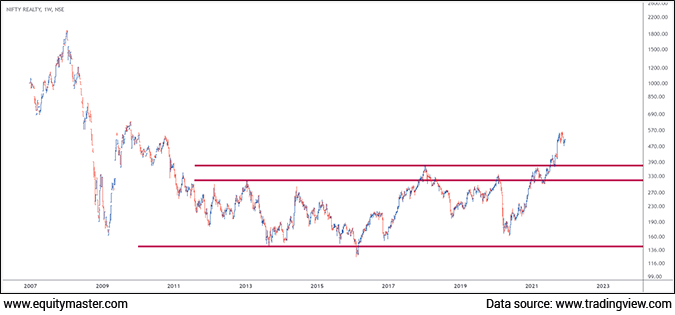
So some of the charts, which I will be sharing on the traditional, is if I look at the realty index, which I have done a video a couple of weeks ago, on the realty space where I have highlighted the multi-year, or the decade range breakout happening in the realty space and the realty index is very, very hot to go higher.
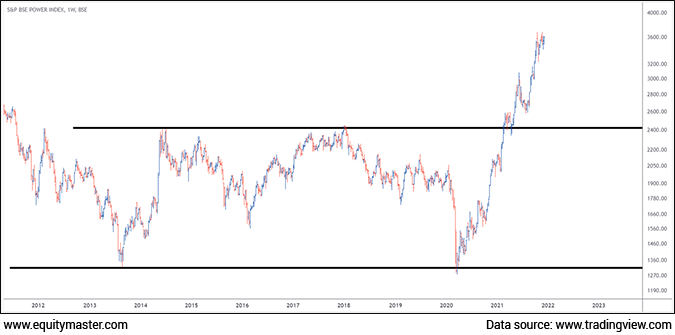
Similarly, on the BSE power index, it consolidated in a range for more than 8-9 years, and then it broke out. So some might prefer the traditional way of investing using technical analysis where the multi-year trend changes and they tend to invest.
Second is inter-market analysis where I am using commodities, where I'm using currencies, and there are bonds, there are a number of stuffs using inter markets. So I've just taken some of the examples in commodity and currency.
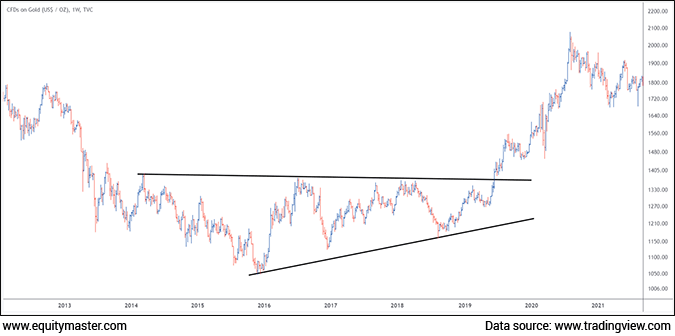
So let's look at the first. This is the gold chart. If you look at the triangle structure over here, this breakout was I guess precisely in July 2019, June or July 2019, when it broke out, and the gold rallied from somewhere around US$ 1,730-1,740 back towards US$ 2,100 during the pandemic times.
If I just look at the inter-market analysis, what are the stocks which can benefit from gold? Some might prefer jewellery stocks, which again is dependable when the gold prices go higher, the inventory gets the margin hits. So again I'm not getting into the fundamental stuff of the debate. But for me, generally, when gold prices go higher, I tend to look at the gold financing companies. So Manappuram and Muthoot, can be one you can look at.
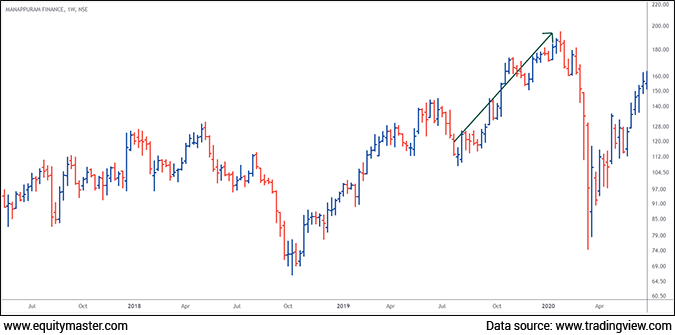
So if I just look at the Manappuram Finance over a here, when the gold price broke out, it was trading at Rs 110-115 and went back to 118 in quick time. So you can look at it in those manners.
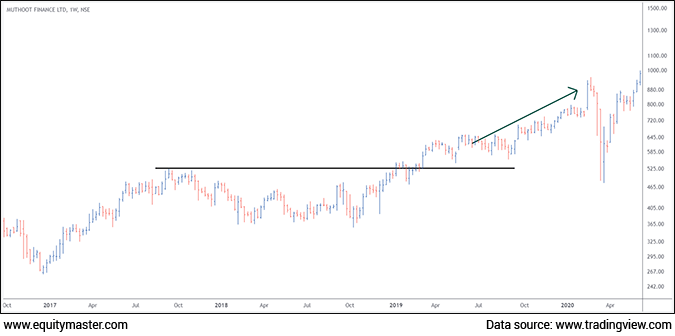
Muthoot Finance if you look at the structure where it broke out from the previous highs, much before the whole process broke out, we have seen a rally from 580-585 to around 880levels on the upside. So you can keep a watch on such commodity space.
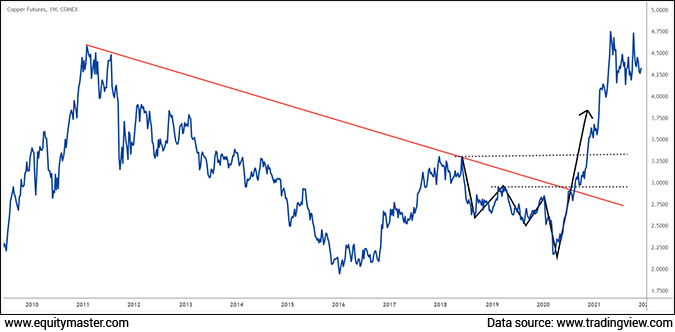
Copper. The most volatile commodity I would say, most traded commodity, after gold and crude, is copper. Now, if you look at copper since 2011, for the first time it broke out from the falling trendline and it broke out somewhere, when the pandemic recovery happened, the V-shaped recovery.
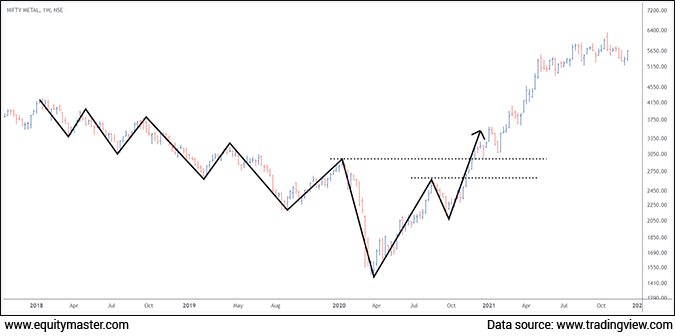
One sector comes into your mind when you look at the copper breakout is the metals space. So if I just look at the metals space, right from 2018, it was forming a lower high lower low structure. The first time, the first time it broke out in July-August, the previous high was taken out. The second high was taken on somewhere in November, start of November or mid of November.
I have created a video at the start of 2021, looking at the same structure that copper prices are breaking out. The CNX Metal index was making a higher high higher low structure for the first time after nearly three years, and I guess, the first of Jan 2021, I did a video on Equitymaster's YouTube channel. You can watch that video as well. I said that this could be the sector you should be watching and investing and this will be sector for the year.
Look at the Nifty Metal Index. It has gone up to the higher level. It nearly gave from around 3,000 to 6,000 levels now. So looking at the copper prices, I looked at the metal index breaking out and I said it's the time to invest. This was the second approach which I look at.

The third approach I use is the ratio analysis to identify the outperformance or underperformance of sectoral indices against the benchmark indices.
So what is ratio analysis? I have done a video on ratio analysis as well. So you can get in detail on how to use it. In simple terms, I am taking a sector and dividing the prices with the benchmark indexes. Be it the Nifty, the CNX 500, whatever you're looking at.
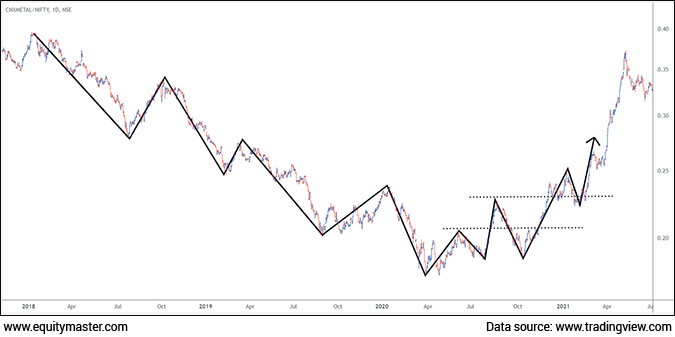
So in this case, this is the metal index, the same chart which I have divided with the Nifty prices. Now, if you look at 2018, the ratio chart was forming lower high lower low structure. If you look at the dotted two black lines, first it broke out in July-August 2020 and if you look at the momentum, the second high was taken out in December probably, in 2020.
There was the second confirmation for me, with the copper prices breaking out with the Nifty Metal Index making higher high higher low structure after ending three years of lower high lower low structure. The outperformance chart is giving me indications that metal prices are about to outperform against the Nifty.
So this was again the third approach where I have seen all together indicated that the metal prices will outperform. So I used these three approaches of technical analysis to identify this sector.
You can try various stuffs. Do comment in the comment section what kind of approach you are using to identify this sector, which could be for trading, which could be for investing, and in case if we like, we can come up with the video in the same so that our audience will also try to learn new things.
Signing off, Brijesh Bhatia. Thank you.
Warm regards,

Brijesh Bhatia
Research Analyst, Fast Profit Report
Equitymaster Agora Research Private Limited (Research Analyst)
Recent Articles
- Pyramiding PSU Bank Stocks September 22, 2023
- How to trade PSU banking stocks now.
- 5 Smallcap Stocks to Add to Your Watchlist Right Now September 12, 2023
- These smallcaps are looking good on the charts. Track them closely.
- Vodafone Idea - Can Idea Change Your Life? September 6, 2023
- What is the right way to trade Vodafone Idea?
- Repro Books Ltd: The Next Multibagger Penny Stock? August 28, 2023
- Is this the next big multibagger penny stock? Find out...


Equitymaster requests your view! Post a comment on "How to Find the Best Sector for Trading". Click here!
Comments are moderated by Equitymaster, in accordance with the Terms of Use, and may not appear
on this article until they have been reviewed and deemed appropriate for posting.
In the meantime, you may want to share this article with your friends!