
How to Find Stocks for Trading Using Technical Analysis
Last week I did a video on how you can use technical analysis to shortlist the best sector for trading.
This time I will go deeper and show you how you can find the best stock to trade.
In this video, I'll take you through this process step by step.
Watch the video and let me know your thoughts in the comments.
Hello viewers. Welcome to the Fast Profits Daily. Myself Brijesh Bhatia.
In the last week, I have done a video on how to select a sector using technical analysis and we have discussed intermarket, we have discussed how commodities rally equates to the equity sector and we used ratio charts there as well, which indicates the outperformance and underperformance.
In this video, I'll be discussing how to select stocks using technical analysis. Well I always use the top down approach. If you have seen my videos, I'll always try to use the top down approach. Be it a weekly chart, monthly chart, coming on to the daily chart, then the lower time frame, which is very, very important.
For You: Midcap Stocks Research at Less than Its Launch Price
If you have seen my ratio analysis chart in the last video, when I was discussing the sector, you can use the same theory in the stocks as well. If you think that the sector is going to outperform, you can try to find the stocks that will outperform in those sectors. That's the way you can try it out.
In this video, I'll be discussing most of the stock selection process for trading. So first, I would suggest, if you're using technical analysis, the most important is defining your strategies. I've done a special video on swing trading as well. So in this video, I'm discussing stock selection process, which is very, very important. I've got many feedbacks that how to select the stocks after the sector.
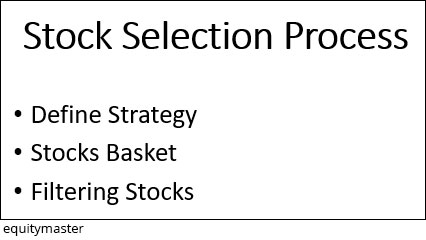
So first define your strategy, your stock basket and here most people lack because people believe that they are treating largecap futures. It doesn't mean that if the stock is in the futures, it's always a largecap. There are midcap stocks as well in the futures.
So we need to create your basket. Do you want to trade, marketcap wise, the highest 100 or you do want to look for a midcap? So you want to look for a microcaps, smallcaps? So here you have to define a strategy and basket, which is very, very important.
Filtering process. So I'll just go through some of the process point by point.
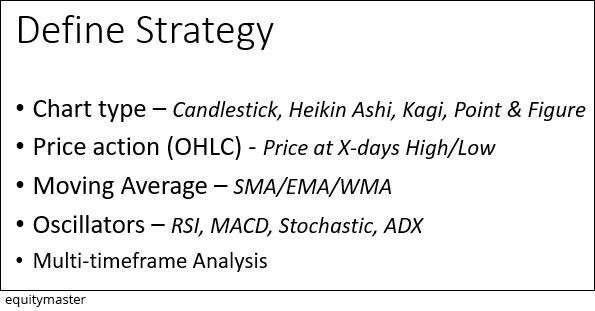
First look at how you should define the strategy. The most important is what type of charts you're using. So there are a number of charts. Bar charts. Candlesticks. Heikin Ashi. Kagi. Point and Figure. Renko is new into the markets. So you have to decide what type of chart you want to use.
So every type of chart will differ on the movement of the prices. So this is very, very important. Generally, bar and candlesticks are same. The body is the difference, and candlesticks are the oldest form as well. So it really helps you out to find out continuation patterns, reversal patterns. If you're using Kagi, P&F, Heikin Ashi, they generally help you to identify a trend continuation pattern. So you need to define what kind of charts you want to use.
Second is price action. Open, high, low. So if prices are, x-days high, I have a strategy as well. When the price hit five days high and above X, Y, Z, average, it's a good bullish momentum. While price is five days below the X, Y, Z average, you can for a short opportunity.
So you have to decide why I'm using this X days you know, because you want the stocks that are into the momentum. Stocks that are stuck into the range will not help you much. I have done a video on investment as well, where price of breaking around 30 days highs, previous two months highs, and there is momentum going on. So you need to decide what kind of strategy you want to play and use this parameter.
Moving average. which is very, very important. Golden crossover which is 50 over 200. Death cross which is 50 below 200. Some people play guppy averages. There are 7 averages, short, medium, and long and if the price is above all the averages, they look for a buy. If the price is below all those guppy averages, they look for a short.
So try various moving averages. It's not necessary that you have to you use the uniform 50 and 200. I sometimes use 55. If you are looking for a commodity, I sometimes use 58 as well on copper prices. So it depends on back testing. Try to find out back testing which is very supportive on the daily timeframe or weekly timeframe.
Oscillators. You need to understand which oscillators to use. RSI is for momentum. MACD is generally a good trend decider. If you're playing stochastics, if you are just playing momentum based trades, then you should use stochastics. If you are looking for a 15 days, 20 days, 30 days, or three months trade, stochastics won't help you. So you need to understand the strengths and it weakens of oscillator.
Multi timeframe analysis. It's very, very important. I'll show you the charts as well, how to use the multi timeframe analysis.
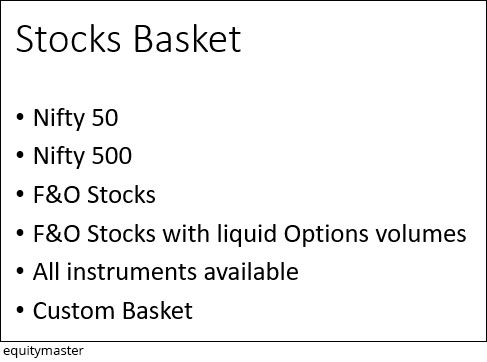
Stock Basket. It depends on what kind of trader you are. What kind of investor you are. If you're looking for a bluechip then Nifty 50, Nifty 100, Nifty 200.
If you want to play all the baskets of midcaps, smallcaps, even largecaps, Nifty 500 is there.
F&O stocks. F&O stocks with liquid options. Look for F&O stocks with options with liquid volumes which means that volumes should be higher. There should be less difference between bid and ask.
All instruments are available. Some people look for microcaps into the BSE and NSE as well. So there are all instruments available. You can create can customise a basket of stocks.
I know some people who play fundamentally but look for an entry on the technical basis. So if you think that this 10-15 stocks are very, very strong, fundamentally and just want to look into those stocks, create those baskets. When you find an opportunity, depending upon the strategies, trade them.
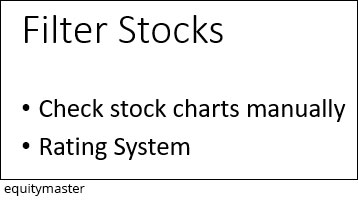
Filtering process. If you are doing this strategy automating the stocks that filter out, say probably it might happen that 10 stocks will filter out. 15 stocks may filter out of your NSE 500 basket or Nifty 500 basket. Which stocks should you trade?
Now I generally look for a filtering system or a ranking system, I would say, depending on if there are 10 stocks, I rank them depending upon risk parameter, depending upon the risk to reward ratio, depending upon the strength they have shown in the volumes. So you can depend upon this ranking system.
I generally use the ranking system manually. You can a code it in a manner you want. So automatically it will show the ranking system as well. So use this ranking system which will definitely help to take convincing trades out of those, 10, 15 stocks defined by your strategy filtration.
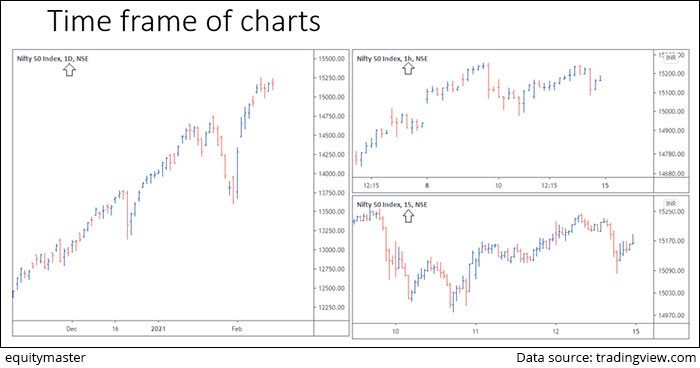
Now, multi time frame. This is very, very important. I generally use this many a times. If you are using a defined strategy, if you have used moving averages, if you have used five days high, if you have used Oscillators, now try to use this on different time frames. I generally use 3 timeframes because I know if I'm using the weekly or daily, if you look at the left side of the chart, that's daily, I know the daily trend is bullish. So I went for a bullish set up when it comes to the hourly charts.
When there is a bullish set up building on the hourly charts when their price move is gaining the momentum especially I would say or trading at support, and 15 minutes in, if you look at the right bottom it's a 15 minute chart, if there is a reversal happening over on the support zone on the hourly, because I know that the daily timeframe is very, very positive, so hourly and 15 minutes will give me a good entry considering the risk reward. So I just look at the hourly, where the basing is forming and the 15 minute, which is a good entry point.
So you can use multi timeframe. If you don't want to look for a very, very short term, look for weekly, daily and four hours. I also use that for three to six months. So this you can use on to the multi timeframe.
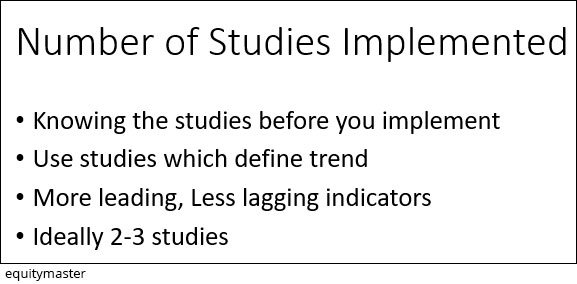
Now there is always a debate. How much, what number of oscillators you should use? So there are people on social media on WhatsApp posting charts where they have two, three oscillators, three, four averages, and they don't give importance to the price. I would suggest give importance to price first and this is very, very important.
So before you implement the studies, try to look for various studies on to the multi timeframe charts. Plot studies on to your charts which will help you because prices are always a leading indicator and oscillators and averages are lagging indicators. Which means that the price will lead and if the price is going from 100 to 150, automatically the average will go higher, RSI will go higher, MACD will go higher.
So you need to understand that price is the leading factor and you can't use a number of averages and a number of oscillators to mitigate that price action. So price action is very, very important for me as a leading indicator. So define first the leading indicators of what we want to look at, then the lagging indicators.
Number of studies. I would say, don't look for more than 2 to 3 studies on your charts. Couple of moving averages and one oscillator is fair enough. Use two averages and one oscillator. If price is breaking out of 10 days average, 5 days average, it is based on what kind of strategy you want to build up, and this is very, very important.
So always keep focus on leading indicators and give less importance to lagging indicators. That's where the ranking systems helps you out. If my leading indicators are pointing out that the momentum is in the stock, lagging indicators will automatically follow the leading indicator and it will automatically turn bullish or bearish, whatever the leading indicator is indicating. So always give more importance to leading and less importance to lagging.
But yes, you need to understand the oscillators if you are using what kind of oscillators you are using, what kind of averages you are using, which is very, very much important when you define your strategy.
So that's all into how to select stocks for trading. In case you are using some of the defined systems and you want to share, do share in our comments and in case you have any doubt on how to build your own defined strategy, if want to discuss defined strategies, do comment. I'll definitely reply and try to give you more clear action on how to use the defined strategy in case you have any doubts.
So signing off, Brijesh Bhatia.
Warm regards,

Brijesh Bhatia
Research Analyst, Fast Profit Report
Equitymaster Agora Research Private Limited (Research Analyst)
Recent Articles
- Pyramiding PSU Bank Stocks September 22, 2023
- How to trade PSU banking stocks now.
- 5 Smallcap Stocks to Add to Your Watchlist Right Now September 12, 2023
- These smallcaps are looking good on the charts. Track them closely.
- Vodafone Idea - Can Idea Change Your Life? September 6, 2023
- What is the right way to trade Vodafone Idea?
- Repro Books Ltd: The Next Multibagger Penny Stock? August 28, 2023
- Is this the next big multibagger penny stock? Find out...
ABOUT EQUITYMASTER
Since 1996, Equitymaster has been the source for honest and credible opinions on investing in India. With solid research and in-depth analysis Equitymaster is dedicated towards making its readers- smarter, more confident and richer every day. Here's why hundreds of thousands of readers spread across more than 70 countries Trust Equitymaster.
PREMIUM PRODUCTS
QUICK LINKS
POPULAR TOPICS
- Multibagger Penny Stocks
- Basics of Value Investing
- Benjamin Graham
- How to Invest in Gold
- How to Invest in Silver
- Best Stocks to Buy Today
- Best Small-cap Stocks to Buy
- Best Bluechip Stocks to Buy
- Guide to Penny Stocks
- How to Invest in the Share Market
- Warren Buffett - The Value Investor
- Pick the Best Multibagger Stocks
TRENDING TOPICS
 Donate to credible NGOs in the sector of your choice (ii) Claim 50% tax benefit u/s 80G (iii) Receive periodic reports.")
Copyright © Equitymaster Agora Research Private Limited.
Whitelist | Refer | Terms | Privacy | Contact | About | Sitemap
Equitymaster Agora Research Private Limited (Research Analyst)
SEBI (Research Analysts) Regulations 2014, Registration No. INH000000537.
103, Regent Chambers, Above Status Restaurant, Nariman Point, Mumbai - 400 021. India.
Telephone: +91-22-61434055. Email: info@equitymaster.com. Website: www.equitymaster.com.
CIN:U74999MH2007PTC175407
Name of the Compliance & Grievance Officer: Ms Sonal Ramachandran
Telephone: +91-22-61434003 | Email: compliance@equitymaster.com
LEGAL DISCLAIMER:
Investment in securities market are subject to market risks. Read all the related documents carefully before investing.
Registration granted by SEBI and certification from NISM in no way guarantee performance of the intermediary or provide any assurance of returns to investors.
All rights reserved. Any act of copying, reproducing or distributing this newsletter whether wholly or in part, for any purpose without the permission of Equitymaster is strictly prohibited and shall be deemed to be copyright infringement.
Equitymaster Agora Research Private Limited (Research Analyst) bearing Registration No. INH000000537 (hereinafter referred as 'Equitymaster') is an independent equity research Company. Equitymaster is not an Investment Adviser. Information herein should be regarded as a resource only and should be used at one's own risk. This is not an offer to sell or solicitation to buy any securities and Equitymaster will not be liable for any losses incurred or investment(s) made or decisions taken/or not taken based on the information provided herein. Information contained herein does not constitute investment advice or a personal recommendation or take into account the particular investment objectives, financial situations, or needs of individual subscribers. Before acting on any recommendation, subscribers should consider whether it is suitable for their particular circumstances and, if necessary, seek an independent professional advice. This is not directed for access or use by anyone in a country, especially, USA, Canada or the European Union countries, where such use or access is unlawful or which may subject Equitymaster or its affiliates to any registration or licensing requirement. All content and information is provided on an 'As Is' basis by Equitymaster. Information herein is believed to be reliable but Equitymaster does not warrant its completeness or accuracy and expressly disclaims all warranties and conditions of any kind, whether express or implied. Equitymaster may hold shares in the company/ies discussed herein. As a condition to accessing Equitymaster content and website, you agree to our Terms and Conditions of Use, available here. The performance data quoted represents past performance and does not guarantee future results.
Equitymaster requests your view! Post a comment on "How to Find Stocks for Trading Using Technical Analysis". Click here!
Comments are moderated by Equitymaster, in accordance with the Terms of Use, and may not appear
on this article until they have been reviewed and deemed appropriate for posting.
In the meantime, you may want to share this article with your friends!