- Home
- Todays Market
- Indian Stock Market News January 16, 2021
Momentum Moves: The Week Gone By Sat, 16 Jan Momentum Moves
Nifty and Sensex ended the week gaining 0.60% and 0.52% respectively.
Bulls started the week roaring but since Wednesday, the momentum seemed to be tiring. This is indicated by smaller body candles on Tuesday, Wednesday, and Thursday on the charts.
Bears grabbed an opportunity and attacked on Friday with Nifty 50 breadth falling to 6 negative stocks against 1 positive.
Tata Motors (+31.40%), Bharti Airtel (+11.55%) and ITC (+8.09) were the top 3 gainers.
Asian Paints (-8.90%), Bajaj Finserv (-5.83%) and Divi's Lab (-5.53%) were top 3 losers in Nifty 50.
Among sectorial Indices, PSU Bank Index gained the most (5.87%) followed by Auto Index (+4.49%) and Realty (+1.15%).
Metals (-2.27%), Pharma (-1.94%) and Media (-1.37%) indices ended the week in negative zone.
--- Advertisement ---
Investment in securities market are subject to market risks. Read all the related documents carefully before investing
Looking to Buy Midcap Stocks?
If you're looking to buy some high-quality midcap stocks, then our co-head of research Rahul Shah has got some great recommendations.
You can get instant access to these stocks by subscribing to his popular stock research service, Midcap Value Alert.
The great news is... as part of Equitymaster's 28th anniversary celebrations... you have the chance to access this service at a huge 80% OFF
Get Full Details
Details of our SEBI Research Analyst registration are mentioned on our website - www.equitymaster.com
---------------------------------------------------
The Week Ahead
Nifty has been rising week-on-week and bulls are having their best time.
In the last 10 weeks, Nifty has managed to close 9 times in positive and only once in the negative.
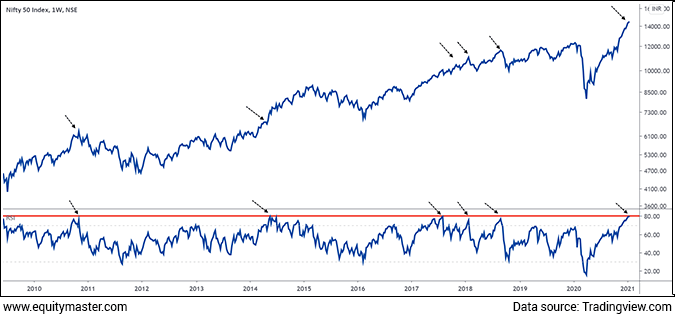
I believe the bulls seem to be tiring. The index is trading in overbought territory which is indicated by the RSI (Relative Strength Index).

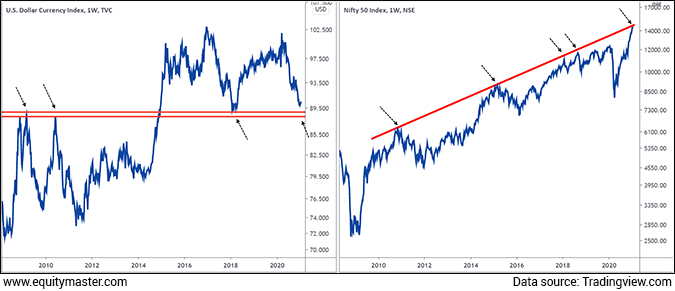
Nifty is also trading at resistance of the 10 years rising trend line.
If we compare it with the Dollar Index, they have an inverse relationship.
--- Advertisement ---
Investment in securities market are subject to market risks. Read all the related documents carefully before investing
Up For Grabs
Equitymaster's Small Cap Research At 60% Off
Claim Now
Details of our SEBI Research Analyst registration are mentioned on our website - www.equitymaster.com
---------------------------------------------
Dollar Index is trading at multi-year support and Nifty at multi-year resistance.
In the video, I compare the Nifty with Dollar Index chart and share my views on this.

For information on how to pick stocks that have the potential to deliver big returns, download our special report now!
Read the latest Market Commentary


Equitymaster requests your view! Post a comment on "Momentum Moves: The Week Gone By". Click here!
Comments are moderated by Equitymaster, in accordance with the Terms of Use, and may not appear
on this article until they have been reviewed and deemed appropriate for posting.
In the meantime, you may want to share this article with your friends!