- Home
- Todays Market
- Indian Stock Market News March 13, 2021
Bulls Exhausted at Higher Levels Sat, 13 Mar Momentum Moves
The Week Gone By
The tug-of-war between bulls and bears in the market ended on a flat to marginally positive note.
Surprisingly, on all the four days of the week, Nifty opened gap-up and bulls were unable to hold the markets higher.
In a truncated week, the first three days of momentum belonged to bulls. The bears on Friday were geared up in the second half of the day to slap the bulls down from 15,300 to 14,950.
As we highlighted in our last's week Momentum Moves, a time correction is on cards. The market might remain in the range of 14,450-15,300. It hit a high of 15,336 in a gap-up but didn't even hold for the first 30 minutes of the day.
Before closing the week, the index has passed the ball in the bears court which we will analyse on the charts in this week's Momentum Moves.
The Week Ahead
The bulls on D-street seems to be exhausted. They could not capitalise on the gap-up openings for four consecutive sessions.
Even after opening higher on Friday above 15,300, the bears took the opportunity to drag markets lower.
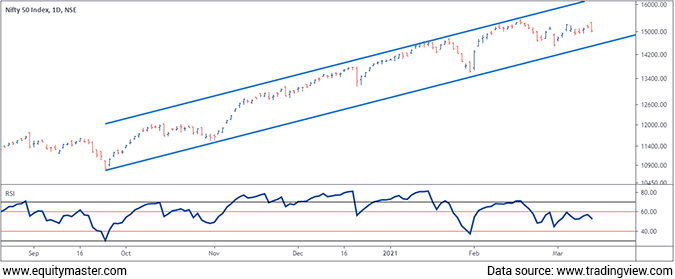
The medium term chart is indicating the trend is bullish as index is trading in rising channel formation.
Daily Nifty Chart

The above is a daily bar chart of Nifty which is trading in rising channel (marked parallel blue lines).
Even though markets rallied from 14,500 to 15,300 levels, RSI (Relative Strength Index) is trending between 40-60. This shows a lack of strength in the momentum.
--- Advertisement ---
Investment in securities market are subject to market risks. Read all the related documents carefully before investing
India's Potentially Decade-Long $10 Trillion Bull Run...
Our Co-Head of Research Tanushree Banerjee believes India is going on a decade-long $10 trillion bull run.
And she has discovered 7 mega trend that could potentially be among the top wealth creators in this upcoming bull run.
At our upcoming event, Tanushree will reveal all the details of this mega opportunity, including the golden buying window to enter India's potentially decade-long $10 trillion bull run.
Click Here to Get Full Details
Details of our SEBI Research Analyst registration are mentioned on our website - www.equitymaster.com
---------------------------------------------------
The index trading in the range of 14,450-15,300 and the RSI hovering in the range of 40-60 is to me a sign of lacklustre momentum in the market.
Even we look at the candlestick on daily chart, the bears might get excited even as the markets trend higher.
Nifty Chart

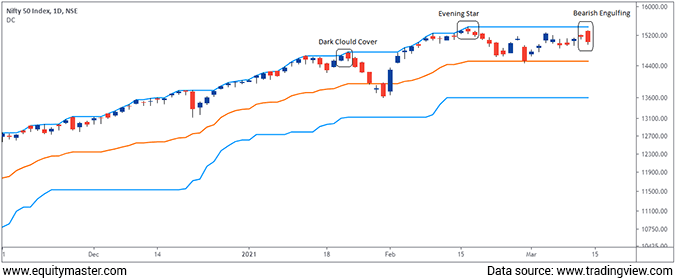
Analysing the candlestick chart above, we see that it has formed Bearish Engulfing pattern. It marks an end of bullish momentum and start of a bearish trend. The confirmation will be below the low of candle which is 14,953.
Importantly, bearish engulfing has formed at an upper band of Donchian Channel.
The 34 period Donchian channel indicates there is resistance at the all-time high of 15,431. These lines are generated by the moving average and the upper & lower bands are formed around a median band.
The upper band marks the highest price over 34 periods while the lower band marks the lowest price over 34 periods.
On the weekly chart, we are witnessing doji candlestick pattern which is indecisive in nature.
The short term trend can only emerge on a break out above 15,431 and below 14,450. Till then markets might consolidate and stock specific action will prolong.
--- Advertisement ---
Investment in securities market are subject to market risks. Read all the related documents carefully before investing
Equitymaster's Premium Research:
Discover the Lucrative Opportunities in India's Emerging Business space
Read This Letter
Details of our SEBI Research Analyst registration are mentioned on our website - www.equitymaster.com
---------------------------------------------
Global Trend of Metals
We have been discussing about the trend in metals for the last 4-6 months in the Fast Profits Daily and in the Fast Profits Report.
As you are a subscriber, we are here to identify money making opportunities. We recommend to hold your metals positions in your portfolio.
Last week, my colleague Vijay Bhambwani talked about the new super cycle in metals. In case you missed it, click here to watch.
I will be showing you one chart comparing Nifty Metals Index with the Nasdaq Metals Index and CRB Thomson Reuters Commodity Index.

The above is weekly chart comparing the metal indices.
The green line is CRB Thomson Reuters Commodity Index formed using 28 commodity prices globally. It's widely followed globally to analyse commodity prices.
If you look at CRB Commodity Index, the trend is bullish as it is heading northwards. When this trends bullish, it is indicates the commodity prices are going higher.
When commodity prices go higher, it's beneficial to the mining and producing companies globally.
Since the bottom of March 2020, the commodity prices have gone higher due to huge demand globally and we have seen positive impact on mining and producing companies.
If we look at the historic move from June 2017 to June 2018 when commodities prices were rising (indicated by CRB Commodity Index), metal indices in India and the US started outperforming against their peers and we witnessed huge rally in metals stocks.
Similarly, we believe the rising commodities prices will have bullish impact on metals stocks and indices in medium to long term.
Though some might argue abouts its effect on inflation which will have negative impact on economy, we would like to discuss that in another edition.
The bullish trend might continue in the metals space globally and Nifty metals index might head above the decade high of 4,256.
Conclusion
The bulls and bears fought in a truncated week and the bulls failed to capitalise on the gap-up openings.
The weekly chart formed a doji candle stick which is indecisive in nature. However, the daily chart formed the bearish engulfing indicating a pause to the bullish momentum, though the confirmation will be below 14,950.
Nifty is like to consolidate and a fresh trend might emerge only below 14,450 or above 15,400.
The metal index will continue to trend higher. When compared with the CRB Commodity Index it highlights the co-relation of commodity prices with the equity metal index in India and US.
We are expecting the new decade high for metal index in India and investors should continue to hold as well as accumulate metals stocks in their portfolio.
For information on how to pick stocks that have the potential to deliver big returns, download our special report now!
Read the latest Market Commentary


Equitymaster requests your view! Post a comment on "Bulls Exhausted at Higher Levels". Click here!
Comments are moderated by Equitymaster, in accordance with the Terms of Use, and may not appear
on this article until they have been reviewed and deemed appropriate for posting.
In the meantime, you may want to share this article with your friends!