- Home
- Todays Market
- Indian Stock Market News March 27, 2021
Nifty: Bear Trap? Sat, 27 Mar Momentum Moves
The Week Gone By
The financial year of uncertainties and opportunities is coming to an end.
Many small business have perished due to their failure to meet working capital. On the other hand, some businesses have flourished with business opportunities.
As we end the last F&O expiry of FY20-21, the bulls have come back aggressively.
Out the 12 expiries of the year, 8 ended on positive note while 4 in the negative. In other words, we have seen gains 66% of the time.
Well, let's see what's in store for us in the Nifty April 2021 expiry.
--- Advertisement ---
Investment in securities market are subject to market risks. Read all the related documents carefully before investing
Looking to Buy Midcap Stocks?
If you're looking to buy some high-quality midcap stocks, then our co-head of research Rahul Shah has got some great recommendations.
You can get instant access to these stocks by subscribing to his popular stock research service, Midcap Value Alert.
The great news is... as part of Equitymaster's 28th anniversary celebrations... you have the chance to access this service at a huge 80% OFF
Get Full Details
Details of our SEBI Research Analyst registration are mentioned on our website - www.equitymaster.com
---------------------------------------------------
The Week Ahead
The April F&O expiry stats will excite the bulls as the historic numbers have been impressive for the last 17 years.
We have checked the returns on Expiry-on-Expiry (E-o-E) for April. Most leveraged positions are covered in the March expiry due to financial year end and fresh positions are built from the first of April.
In the last 17 years, bulls have ended the April expiry 13 times. 4 times it has been in the favour of the bears. The average returns are 3.39% for the same period.
If we look at the Month-on-Month (M-o-M) returns, the numbers are 12 in favour of the bulls and 5 for the bears. The average returns are 3.19%.
The historic numbers are exciting but is the technical structure in sync with the historic move?
In this edition of Momentum Moves, we will analyse Nifty and compare it with other Asian indices.
The last week's fall below 14,300 has certainly changed the sentiments on D-street and with that most of the March series.
In the last 25 years (1996 to 2020), March has ended in the negative zone 14 times, thus changing the sentiments for the bulls.
But the break of 14,300 seems to be a bear trap if we compare the move with other Asian indices.
| Year | Returns (E-o-E) | Returns (M-o-M) |
|---|---|---|
| 2004 | 6.13% | 1.37% |
| 2005 | -4.63% | -6.54% |
| 2006 | 2.61% | 4.56% |
| 2007 | 10.00% | 6.97% |
| 2008 | 3.51% | 9.11% |
| 2009 | 12.71% | 15.00% |
| 2010 | -0.12% | 0.55% |
| 2011 | -0.83% | -1.44% |
| 2012 | 0.20% | -0.90% |
| 2013 | 4.11% | 4.36% |
| 2014 | 3.00% | -0.12% |
| 2015 | -1.93% | -3.65% |
| 2016 | 1.41% | 1.44% |
| 2017 | 1.84% | 1.42% |
| 2018 | 4.98% | 6.19% |
| 2019 | 0.62% | 1.07% |
| 2020 | 14.10% | 14.68% |
*M-o-M = Month to Month
Nifty - The Bear Trap
March has been more of a range bound or consolidation phase for markets which we have termed as a time correction.
We have highlighted this is in the Momentum Moves in the first week of March.
The index played out exactly what we expected. You can watch that video here.
--- Advertisement ---
Investment in securities market are subject to market risks. Read all the related documents carefully before investing
Up For Grabs
Equitymaster's Small Cap Research At 60% Off
Claim Now
Details of our SEBI Research Analyst registration are mentioned on our website - www.equitymaster.com
---------------------------------------------
Though Nifty ended the expiry at the lowest level of 14,324.90 (low of 14,264.40), the April series started on bullish note.
We thought that as the indices ended at the lowest level, the bearish move might prolong but when we analysed the chart in detail, it seemed to be bear trap.
Nifty Weekly Chart
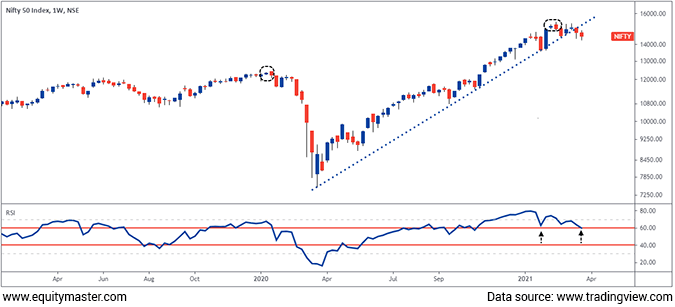
The above weekly chart of Nifty has all the elements which will excite the bears to just go and short the markets.
The bearish engulfing (circled black) above formed right at an all-time high (similar structure was seen in January 2020) and rest is the history.
Rising trendline breakdown is also in sync with the bears as on consecutive weeks, we closed below the same.
What did not convince us to go short was the Relative Strength Index (RSI) in the lower panel of chart.
We have seen it falling into the neutral zone yet and it is still in the bullish zone.
Nifty Daily Chart
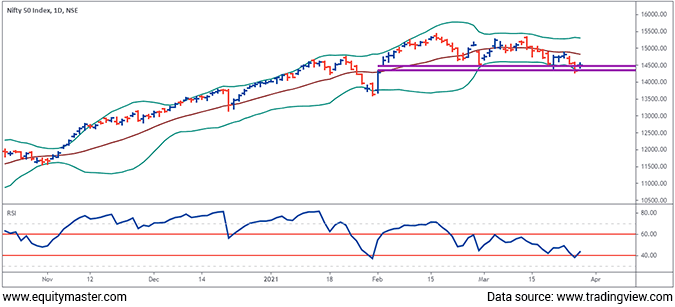
The daily chart of Nifty above indicates the confluence of supports at 14,300 levels.
First, the gap area of February in the range of 14,336-14,469 is being filled and the index has reversed.
Secondly, the index is taking support at the lower band of the Bollinger Band (BB) being marked by green and brown lines. The BB is formed by using +2/-2% deviation of the 20 days moving average.
--- Advertisement ---
Investment in securities market are subject to market risks. Read all the related documents carefully before investing
Up For Grabs:
Equitymaster's Small Cap Research At 60% Off
Claim Now
Details of our SEBI Research Analyst registration are mentioned on our website - www.equitymaster.com
---------------------------------------------------
RSI has come to rescue the bulls again as it has tested the 40 mark and turned northwards indicating the bulls are still in control.
Looking at the weekly and daily chart, we believe the dip to 14,264 can be bear trap and we may head higher again.
However, we will wait for a confirmation above the recent high of 14,878.
Further to confirm the bear trap, we analysed other Asian indices to check the trend and surprise....
Nikkei 225, Japan
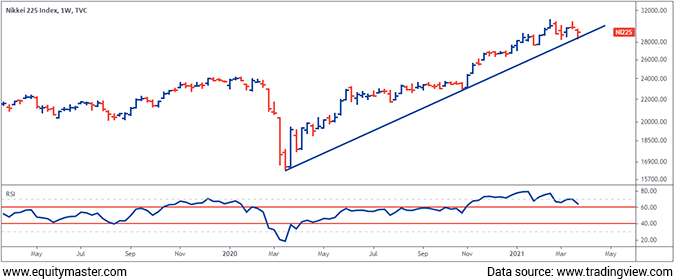
It seems you have seen this chart before. Yes, it's a similar structure to the Nifty.
The rising trendline from the March 2020 lows is held strongly by the bulls. Last week, the Nikkei index tested the trendline and reversed expediently to form a hammer candlestick.
RSI on the lower panel is in the bullish zone as it is trending above the 60 mark.
Kospi, Korea
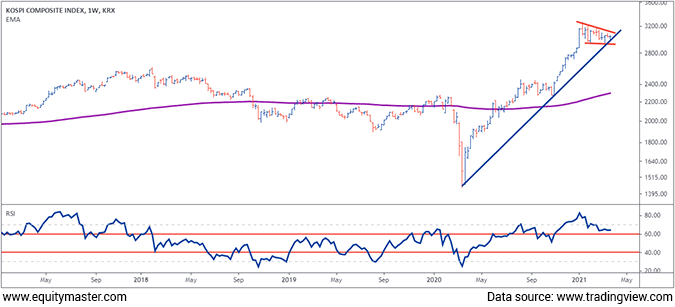
The weekly chart of Kospi is trending bullish. It's forming higher high - higher low structure and at confluence of supports at the rising trendline and triangle.
RSI trending bullish is sync with the price action. This is convincing the bulls they are having the upper hand.
Importantly, the structure of monthly chart is more bullish than weekly chart of Kospi.
Kospi Monthly Chart
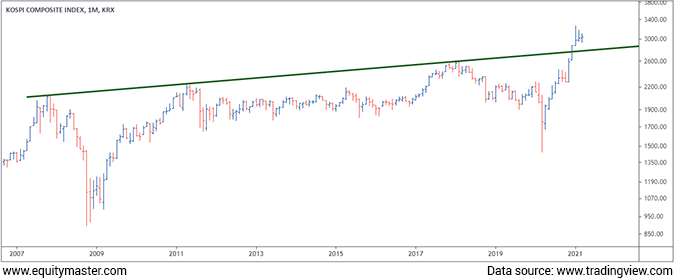
The monthly chart above has just confirmed the breakout of the multi-year trendline.
The 2007, 2011, and 2018 highs connected had a breakout at 2,750 and the index trading above that level is sign of fresh long-term breakout.
I see this bullish trend till 2024-2025 for Kospi and Korea can be one of the best financial markets to invest.
Shanghai Composite Index, China
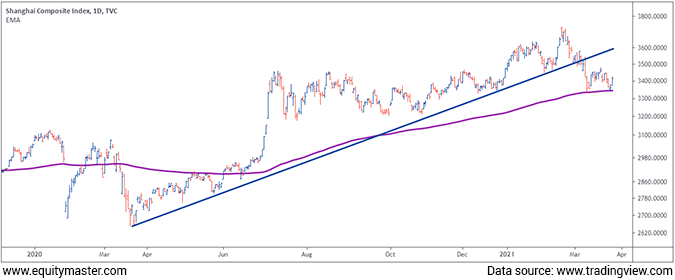
Shanghai Composite Index is one of unperforming indices in the last one year but if we look at the technical structure, it says a lot.
Index has broken the rising trendline but if we look at the co-relation with other Asian indices, they are not in sync and are outperforming by big margins.
It has taken multiple supports at long-term moving average of 200 days and is in process of forming a double bottom structure (the confirmation is yet to come).
If the index breaks out of double bottom structure which is above 3,500, we may see it back to 3,730-3,800 levels.
Conclusion
The bearish move in the last week has certainly raise concern in minds of investors in India with the Nifty forming a lower low and the trendline being broken.
We believe this to be bear trap.
RSI on weekly and daily chart of Nifty are indicating the bulls are still in control while other Asian indices like Nikkei, Kospi, and Shanghai boosting the bullish sentiments.
The bulls should use this dip as good opportunity and cherry pick stocks.
The structure can confirm the bear trap once it moves above 14,900 levels.
On the other hand, our expectation of a bear trap fails if 14,200 is broken on the down side.
But we are biased in that the lows of 14,264 will be held by bulls.
We might see Nifty once again moving as per the historical moves in April.
For information on how to pick stocks that have the potential to deliver big returns, download our special report now!
Read the latest Market Commentary


Equitymaster requests your view! Post a comment on "Nifty: Bear Trap?". Click here!
Comments are moderated by Equitymaster, in accordance with the Terms of Use, and may not appear
on this article until they have been reviewed and deemed appropriate for posting.
In the meantime, you may want to share this article with your friends!