- Home
- Views On News
- Feb 2, 2023 - Adani Group Stocks: Beginning of the End?
Adani Group Stocks: Beginning of the End?
Adani group stocks are the talk of the town since the Hindenburg report was released.
Some of the group stocks have corrected over 50% from their highs, in a matter of days.
Post the sharp correction in stock prices, Credit Suisse and Citigroup Wealth have raised eyebrows on their bonds and pledged shares.
Investors have a soft corner for some of the group stocks as performance of some Adani stocks and their returns since the pandemic have been astonishing.
Is this the beginning of the end for Adani group stocks?
I believe a stock price doesn't rise or fall in a linear line.
And that's the case with the Adani stocks.
Unfortunately, the questions raised resulted in a sharp falls.
Just imagine being an investor in Adani stocks!
If this fall is an impact of the market correction, will you buy the stocks?
I am unbiased towards the Adani stocks, but the charts say this is not the end.
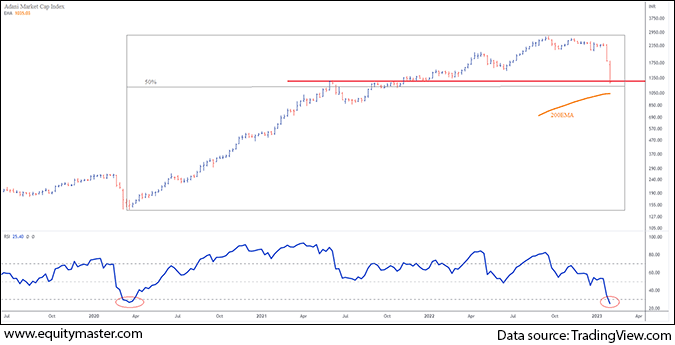
Adani Marketcap Index Weekly Chart

The Adani Marketcap Index weekly chart above is created using the stocks of the Adani group listed on the National Stock Exchange (NSE) as per the closing of 1 February 2023.
We haven't considered Adani Wilmar Ltd (AWL) while creating the index because it was a recent listing, and we didn't have enough data to analyse it.
AWL contributes 5% weight in the total marketcap of Adani stocks. Hence, this chart represents 95% of the total marketcap of Adani group.
The index is trending at the crucial support zone on the chart. Here are some key observations...
- Post the rally between March 2020 to April 2021, the index consolidated. The breakout from the high resumed the rally and the resistance may turn support now (horizontal red line).
- 50% Fibonacci retracement of the rally from March 2020 to the highs of 2022.
- The 200WEMA (Weekly Exponential Moving Average) will act as a major support zone (orange line).
- Relative Strength Index (RSI) has moved into the oversold zone.
The charts depict this fall as a retracement as of now.
I will wait for the dust to settle. If the index manages to hold its 200WEMA, we may expect a time correction for a few quarters before the long-term effect falls in place.
Investors should manage their risk and keep track of the latest developments and fundamentals of Adani group stocks.
At present, most Adani stocks are down with Adani Total Gas and Adani Transmission being the top losers, down 10%.
I'll share more on his trend on my Telegram group. If you're interested in being part of my charting journey as I share how to create wealth from profitable trade setups, join my telegram channel - Fast Profits Daily.
Disclaimer: This article is for information purposes only. It is not a stock recommendation and should not be treated as such. Learn more about our recommendation services here...

Brijesh Bhatia Research Analyst and expert chartist, is the editor of Alpha Wave Profits. Fully committed to his craft, Brijesh has mastered the art of making money by trading using technical analysis. Brijesh has an MBA from ICFAI and 16 years of experience in India's financial markets. He began his career on Dalal Street as commodities dealer and it wasn't long before he developed his own unique trading system. Brijesh worked on his trading system until it could be expected to deliver 5 units of return for every unit of risk.


Equitymaster requests your view! Post a comment on "Adani Group Stocks: Beginning of the End?". Click here!
Comments are moderated by Equitymaster, in accordance with the Terms of Use, and may not appear
on this article until they have been reviewed and deemed appropriate for posting.
In the meantime, you may want to share this article with your friends!