
MEMBER'S LOGINX
| Invalid Username / Password | ||||||||
| Invalid Captcha | ||||||||
|
||||||||
| Sign Up | Forgot Password? | ||||||||
- Home
- Views On News
- Apr 11, 2024 - Best Metal Stock: JSW Steel vs Tata Steel vs Hindalco
Best Metal Stock: JSW Steel vs Tata Steel vs Hindalco

India is one of the largest producers of steel and among the top five aluminium producers in the world.
Being self-sufficient in metallic minerals such as iron ore, coal, bauxite, and chromite has given India a clear advantage in maintaining low production and conversion costs.
This, coupled with steady ramp up in infrastructure, automobile production, and high demand from power and cement industries, has helped the Indian metal industry scale new heights.
With recovery in global PMI (purchasing manager's index), and significant rise in manufacturing activities of US and China, the global demand for metals is heightened.
India, being one of the prominent producers of metals, is one of the primary beneficiaries.
In today's article, we compare the three major players in the Indian metal industry that are the likely beneficiaries.
Business Overview
#JSW Steel
JSW Steel, part of the Jindal Group, is one of the country's leading steel producers.
The company has a diversified portfolio of products such as hot-rolled, cold-rolled, galvanneal, galvanised, pre-painted, tinplate, electrical steel, wire rods, and other value added products.
It has a strong domestic presence across 17,500 retail stores, 2,475 points of sales, 450 distributors, and 2,475 branded stores.
#Tata Steel
Part of the Tata Group, Tata Steel is Asia's first integrated private steel company.
Established in 1907, the company has presence across the entire value chain of steel manufacturing from mining and processing iron ore and coal to producing and distributing finished steel products.
It has a strong network of 250 distributors and 20,400 dealers covering close to 95% of the districts in India.
#Hindalco Industries
Part of the Aditya Birla Group, Hindalco is primarily engaged in the manufacturing of aluminium and copper.
It also manufactures chemicals such as calcined alumina and aluminium hydrates used in the water treatment industry.
The company has a wide product portfolio that caters to the needs of FMCG, aerospace, automotive, construction, and industrial and household appliances.
Through its subsidiary, Novelis, which is also the world's largest recycler of aluminium, Hindalco manufactures automotives and beverage can sheet.
| Particulars | JSW Steel | Tata Steel | Hindalco Industries |
|---|---|---|---|
| Market Cap (in Rs billion)* | 2160.0 | 2057.0 | 1353.0 |
| Manufacturing Capacity (in million tonnes) | 28.30 | 21.60 | 3.60 |
In terms of marketcap, JSW Steel is the largest company with a marketcap of Rs 2,160 billion (bn) followed by Tata Steel (Rs 2,057 bn), and Hindalco (Rs 1,353 bn).
JSW Steel also has the highest manufacturing capacity of 28.3 million tonnes per annum (MTPA), followed by Tata Steel with 21.6 MTPA.
Hindalco, being a pure aluminium and copper player, has the capacity to produce 3.6 MTPA of alumina, 1.3 MTPA of primary aluminium, 4.1 MTPA of Novelis rolling capacity, and 0.54 MTPA of copper rods.
Hindalco is also a leading player in the non-ferrous domestic industry, with a 40% market share in flat-rolled products.
Tata Steel, on the other hand, is a leading supplier to the automotive industry with a market share of 38%.
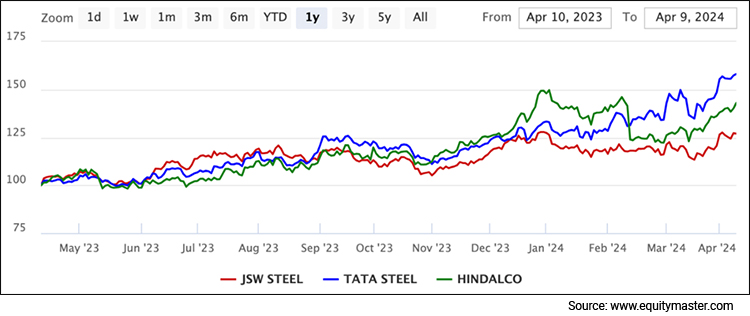
If we compare the yearly performance of these three metal stocks, Tata Steel is leading with a return of 53.5%, followed by Hindalco Industries (44.1%) and JSW Steel (23.8%).
#Revenue
In terms of revenue growth, JSW Steel is leading with a compounded annual growth rate (CAGR) of 14.4% in the last five years.
This is primarily because the company has ramped up its production capacities over the past few years.
Moreover, the company also has a wide product portfolio, which has contributed to revenue growth.
After JSW Steel, Hindalco witnessed a high revenue growth of 11.3% CAGR in the last five years.
Stable demand for aluminium and healthy growth in copper demand have supported the revenue growth.
Tata Steel also witnessed a revenue growth of 9.1% in the last five years, primarily due to growth in sales volume.
Revenue
| Net Sales (in Rs m) | Mar -2019 | Mar -2020 | Mar -2021 | Mar -2022 | Mar -2023 | 5-Year CAGR |
|---|---|---|---|---|---|---|
| JSW Steel | 847,570 | 733,260 | 798,390 | 1,463,710 | 1,659,600 | 14.4% |
| Tata Steel | 1,576,690 | 1,489,717 | 1,564,774 | 2,439,592 | 2,433,527 | 9.1% |
| Hindalco Industries | 1,305,420 | 1,181,440 | 1,320,080 | 1,950,590 | 2,232,020 | 11.3% |
#Profitability
In terms of profitability, Hindalco is the only company that has witnessed healthy profit growth.
The earnings before interest tax depreciation and amortisation (EBITDA) of Hindalco has grown at a CAGR of 8.3% in the last five years.
This is primarily because the company has full alumina integration with captive bauxite mines and stable coal cost with around 90% coal security through a combination of linkages from Coal India.
The net profit also grew at a CAGR of 12.9% during the same period.
Tata Steel's EBITDA grew by a CAGR of 2.1%, whereas the net profit of saw a degrowth of 2.5% in the last five years.
Captive iron ore and coal mines and captive power have helped the company reduce its production costs.
However, the net profit and EBITDA took a hit in financial year 2023, primarily due to its European operations.
There was a margin compression led by low realisations, and high input costs which affected the entire company's profitability.
The company is working on reducing its costs and improving profitability by replacing the blast furnaces with electric furnaces.
JSW Steel saw a muted growth in its EBITDA and negative growth in net profit of 11.3% in the last five years.
Iron ore shortage, and high coal prices affected the profitability of the company. To add to this, weak financial performance of its overseas subsidiaries has also contributed to low growth in profits.
Nevertheless, the risks are partially mitigated by the growing contribution of products with high-margin value added.
Profitability
| EBITDA (in Rs m) | Mar -2019 | Mar -2020 | Mar -2021 | Mar -2022 | Mar -2023 | 5-Year CAGR |
|---|---|---|---|---|---|---|
| JSW Steel | 189,520 | 109,780 | 199,550 | 391,830 | 190,010 | 0.1% |
| Tata Steel | 294,871 | 130,803 | 297,884 | 640,051 | 327,880 | 2.1% |
| Hindalco Industries | 152,240 | 138,160 | 166,890 | 288,350 | 226,600 | 8.3% |
| PAT (in Rs m) | Mar -2019 | Mar -2020 | Mar -2021 | Mar -2022 | Mar -2023 | 5-Year CAGR |
| JSW Steel | 75,540 | 39,190 | 78,730 | 209,380 | 41,390 | -11.3% |
| Tata Steel | 91,873 | 11,725 | 81,898 | 417,493 | 80,754 | -2.5% |
| Hindalco Industries | 54,950 | 37,670 | 51,820 | 142,010 | 100,970 | 12.9% |
| Gross Profit Margin (%) | Mar -2019 | Mar -2020 | Mar -2021 | Mar -2022 | Mar -2023 | |
| JSW Steel | 22.4% | 15.0% | 25.0% | 26.8% | 11.4% | |
| Tata Steel | 18.7% | 8.8% | 19.0% | 26.2% | 13.5% | |
| Hindalco Industries | 11.7% | 11.7% | 12.6% | 14.8% | 10.2% | |
| Net Profit Margin | Mar -2019 | Mar -2020 | Mar -2021 | Mar -2022 | Mar -2023 | |
| JSW Steel | 8.9% | 5.3% | 9.9% | 14.3% | 2.5% | |
| Tata Steel | 5.8% | 0.8% | 5.2% | 17.1% | 3.3% | |
| Hindalco Industries | 4.2% | 3.2% | 3.9% | 7.3% | 4.5% |
#Financial Efficiency
We can measure the financial efficiency of a business by checking its return on equity (RoE) and return on capital employed (RoCE) numbers.
These return ratios indicate a company's ability to generate returns from the equity and capital invested. A high and consistently growing ratio is considered better.
The five-year average RoE for JSW Steel, Tata Steel, and Hindalco is 17.5%, 14.2%, and 10.5%, respectively, whereas the five-year average RoCE is 17.4%, 17.1%, and 11.7%, respectively.
All the three companies have witnessed a fall in return ratios in financial year 2023 primarily due to high input costs. However, JSW Steel and Tata Steel witnessed a steeper fall when compared to Hindalco.
Financial Efficiency
| Return on Equity (RoE) | Mar -2019 | Mar -2020 | Mar -2021 | Mar -2022 | Mar -2023 |
|---|---|---|---|---|---|
| JSW Steel | 21.8% | 10.7% | 17.3% | 31.2% | 6.3% |
| Tata Steel | 14% | 1.60% | 11.10% | 36.50% | 7.80% |
| Hindalco Industries | 9.5% | 6.5% | 7.8% | 18.1% | 10.6% |
| Return on Capital Employed (RoCE) | Mar -2019 | Mar -2020 | Mar -2021 | Mar -2022 | Mar -2023 |
| JSW Steel | 23.5% | 9.0% | 16.8% | 27.8% | 9.9% |
| Tata Steel | 15.8% | 3.7% | 15.3% | 35.0% | 15.9% |
| Hindalco Industries | 11.2% | 8.7% | 9.3% | 18.0% | 11.5% |
#Debt Management
To find out which company is managing its debt better, we look at the debt-to-equity ratio.
A debt to equity ratio below 1 is considered ideal. Moreover, a falling ratio indicates the company is actively deleveraging.
Further, an increasing interest coverage ratio indicates high liquidity and cash flows.
The debt-to-equity ratio of Tata Steel fell from 1.2x to 0.5x in the last five years.
The company is concentrating on reducing the burden of loans on its balance sheet despite investing heavily in capex.
Tata Steel has planned a capex of Rs 340 bn for the next two years to ramp its capacity from to 30 MTPA by 2030 and maintain minimal debt on its books.
At the end of financial year 2023, its interest coverage ratio was 3.9x.
After Tata Steel, Hindalco has reduced the debt on its books from 0.8x to 0.5x in the last five years, primarily due to high cashflows led by healthy profitability. However, the total long-term debt went up slightly.
The company invested to ramp up its capacity in the past, and continues to do so, by maintaining minimal debt.
For the next two years, Hindalco has planned a capex of Rs 400 bn to ramp up its capacities.
At the end of financial year 2023, its interest coverage ratio was 4.6x.
JSW Steel, on the other hand, maintained its debt-to-equity ratio at 0.9x, but the total long-term debt went up by three times.
The company had invested heavily in capex to expand its production capacity. This led to an increase in total debt. However, the company has planned to repay its loans in phased manner to reduce its debt.
It is planning to invest Rs 440 bn in capex until 2026 to ramp up its production capacity further.
At the end of financial year 2023, its interest coverage ratio was 1.8x.
Debt Management
| Debt to Equity Ratio (x) | Mar -2019 | Mar -2020 | Mar -2021 | Mar -2022 | Mar -2023 |
|---|---|---|---|---|---|
| JSW Steel | 0.9 | 1.2 | 1.1 | 0.9 | 0.9 |
| Tata Steel | 1.2 | 1.4 | 0.9 | 0.4 | 0.5 |
| Hindalco Industries | 0.8 | 1.0 | 0.9 | 0.7 | 0.5 |
#Dividend
Companies share their profits with the shareholders in the form of dividends.
A high and consistent dividend is a good sign for a business as it indicates steady profitability.
In the last five years, Tata Steel and Hindalco increased their dividend per share by 93.4% and 20.1% CAGR.
The dividend yield and dividend payout ratio also increased consistently.
For Tata Steel, the average dividend yield and dividend payout are 0.9% and 14.3%, respectively, whereas for Hindalco, the average dividend yield and dividend payout are 0.8% and 7.3%, respectively.
The average dividend payout and dividend yield for JSW Steel is 1.5% and 17%, respectively.
Dividend
| Dividend Per Share (Rs) | Mar -2019 | Mar -2020 | Mar -2021 | Mar -2022 | Mar -2023 | 5-Year CAGR |
|---|---|---|---|---|---|---|
| JSW Steel | 4.0 | 2.0 | 6.4 | 17.0 | 3.3 | -3.7% |
| Tata Steel | 0.1 | 0.1 | 0.2 | 0.5 | 3.5 | 93.4% |
| Hindalco Industries | 1.2 | 1.0 | 3.0 | 4.0 | 3.0 | 20.1% |
| Dividend Yield | Mar -2019 | Mar -2020 | Mar -2021 | Mar -2022 | Mar -2023 | |
| JSW Steel | 1.2% | 0.9% | 2.1% | 2.8% | 0.5% | |
| Tata Steel | 0.2% | 0.2% | 0.5% | 0.4% | 3.3% | |
| Hindalco Industries | 0.5% | 0.7% | 1.3% | 0.8% | 0.7% | |
| Dividend Payout Ratio | Mar -2019 | Mar -2020 | Mar -2021 | Mar -2022 | Mar -2023 | |
| JSW Steel | 13.0% | 12.3% | 19.9% | 19.9% | 19.8% | |
| Tata Steel | 1.7% | 10.3% | 3.7% | 1.5% | 54.4% | |
| Hindalco Industries | 4.9% | 5.9% | 12.9% | 6.3% | 6.6% |
#Valuation
Valuation ratios help us estimate the intrinsic value of a company, and also help us analyse whether a company's shares are overvalued or undervalued when compared to its peers.
The two popular valuation ratios are price to earnings (P/E) and price to book value (P/B). A high ratio indicates the shares are overvalued, a low ratio indicates the shares are undervalued.
The P/E ratios of JSW Steel, Tata Steel, and Hindalco are 18.8x, 106x, and 14.4x, respectively. In terms of P/E, Tata Steel shares are highly overvalued when compared to the other two companies.
However, in terms of P/B, JSW Steel's shares are overvalued compared to those of its peers.
When compared to the industry average, JSW Steel and Tata Steel are overvalued, whereas Hindalco is undervalued.
| Valuations | JSW Steel | Tata Steel | Hindalco Industries |
|---|---|---|---|
| P/E (x) | 18.8 | 106.0 | 14.4 |
| P/B (x) | 2.8 | 2.3 | 1.3 |
Which Metal Stock is Better: JSW Steel, Tata Steel or Hindalco?
In terms of revenue growth, profit margins, and financial efficiency, JSW Steel is leading.
However, in terms of profit growth and consistent growth in return ratios, Hindalco outpaced its peers.
Hindalco is investing over Rs 400 bn in capex to ramp up its production capacity across downstream products.
It is also shifting its focus from being a metal manufacturer to a solution provider by offering a wide range of products to meet the end-to-end requirements of its customers.
JSW Steel aims to increase its production capacity to 50 MTPA by 2030 by investing Rs 440 bn through brownfield and greenfield expansion.
The company is also continuously innovating to develop new products. In just a quarter, it got approval for 12 products.
It also launched the JSW One TMT private brand to cater to the needs of medium and small-sized enterprises.
Tata Steel, on the other hand, is planning to ramp up its capacity to 30 MTPA by 2030.
It is also developing new products to widen its product portfolio.
The company also entered into a joint venture with UK government to set up electric furnace and minimise the cash loss from the UK business.
Given the growing demand for metals across various industries such as automobile, infrastructure, railways, and construction, the capex investments of the companies couldn't come at a better time.
All the three companies are well equipped to cater to the growing demand for metals.
However, Hindalco has delivered a superior performance despite increasing input costs.
Happy Investing!
Safe Stocks to Ride India's Lithium Megatrend
Lithium is the new oil. It is the key component of electric batteries.
There is a huge demand for electric batteries coming from the EV industry, large data centres, telecom companies, railways, power grid companies, and many other places.
So, in the coming years and decades, we could possibly see a sharp rally in the stocks of electric battery making companies.
If you're an investor, then you simply cannot ignore this opportunity.
Details of our SEBI Research Analyst registration are mentioned on our website - www.equitymaster.comDisclaimer: This article is for information purposes only. It is not a stock recommendation and should not be treated as such. Learn more about our recommendation services here...
ABOUT EQUITYMASTER
Since 1996, Equitymaster has been the source for honest and credible opinions on investing in India. With solid research and in-depth analysis Equitymaster is dedicated towards making its readers- smarter, more confident and richer every day. Here's why hundreds of thousands of readers spread across more than 70 countries Trust Equitymaster.
PREMIUM PRODUCTS
QUICK LINKS
POPULAR TOPICS
- Multibagger Penny Stocks
- Basics of Value Investing
- Benjamin Graham
- How to Invest in Gold
- How to Invest in Silver
- Best Stocks to Buy Today
- Best Small-cap Stocks to Buy
- Best Bluechip Stocks to Buy
- Guide to Penny Stocks
- How to Invest in the Share Market
- Warren Buffett - The Value Investor
- Pick the Best Multibagger Stocks
TRENDING TOPICS
 Donate to credible NGOs in the sector of your choice (ii) Claim 50% tax benefit u/s 80G (iii) Receive periodic reports.")
Copyright © Equitymaster Agora Research Private Limited.
Whitelist | Refer | Terms | Privacy | Contact | About | Sitemap
Equitymaster Agora Research Private Limited (Research Analyst)
SEBI (Research Analysts) Regulations 2014, Registration No. INH000000537.
103, Regent Chambers, Above Status Restaurant, Nariman Point, Mumbai - 400 021. India.
Telephone: +91-22-61434055. Email: info@equitymaster.com. Website: www.equitymaster.com.
CIN:U74999MH2007PTC175407
Name of the Compliance & Grievance Officer: Ms Sonal Ramachandran
Telephone: +91-22-61434003 | Email: compliance@equitymaster.com
LEGAL DISCLAIMER:
Investment in securities market are subject to market risks. Read all the related documents carefully before investing.
Registration granted by SEBI and certification from NISM in no way guarantee performance of the intermediary or provide any assurance of returns to investors.
All rights reserved. Any act of copying, reproducing or distributing this newsletter whether wholly or in part, for any purpose without the permission of Equitymaster is strictly prohibited and shall be deemed to be copyright infringement.
Equitymaster Agora Research Private Limited (Research Analyst) bearing Registration No. INH000000537 (hereinafter referred as 'Equitymaster') is an independent equity research Company. Equitymaster is not an Investment Adviser. Information herein should be regarded as a resource only and should be used at one's own risk. This is not an offer to sell or solicitation to buy any securities and Equitymaster will not be liable for any losses incurred or investment(s) made or decisions taken/or not taken based on the information provided herein. Information contained herein does not constitute investment advice or a personal recommendation or take into account the particular investment objectives, financial situations, or needs of individual subscribers. Before acting on any recommendation, subscribers should consider whether it is suitable for their particular circumstances and, if necessary, seek an independent professional advice. This is not directed for access or use by anyone in a country, especially, USA, Canada or the European Union countries, where such use or access is unlawful or which may subject Equitymaster or its affiliates to any registration or licensing requirement. All content and information is provided on an 'As Is' basis by Equitymaster. Information herein is believed to be reliable but Equitymaster does not warrant its completeness or accuracy and expressly disclaims all warranties and conditions of any kind, whether express or implied. Equitymaster may hold shares in the company/ies discussed herein. As a condition to accessing Equitymaster content and website, you agree to our Terms and Conditions of Use, available here. The performance data quoted represents past performance and does not guarantee future results.
Equitymaster requests your view! Post a comment on "Best Metal Stock: JSW Steel vs Tata Steel vs Hindalco". Click here!
Comments are moderated by Equitymaster, in accordance with the Terms of Use, and may not appear
on this article until they have been reviewed and deemed appropriate for posting.
In the meantime, you may want to share this article with your friends!