- Home
- Archives
Archives... Don't Miss Anything, Ever!
Here you will find all the research and views that we post on Equitymaster. Use the tools to customize the results to suit your preference!
 Top Railway Shares in India 2024: Railway Companies to Add to Your Watchlist
May 5, 2024
These lesser-known companies are prime candidates to benefit from this decade's railway investment boom.
 Massive Breakout on Charts! 5 Stocks Hitting Multi-Year Highs
May 5, 2024
The Indian stock market has been on a tear in 2024, and several stocks are breaking out to multi-year highs.
 Best Chemical Stock: Deepak Nitrite vs SRF
May 4, 2024
The Indian chemical sector is finally out of the woods and these two companies are all set to ride the growth wave.
 Best EV Battery Maker: Exide Industries vs Amara Raja Energy & Mobility
May 4, 2024
Government initiatives like PLI and electrification of India's vehicle fleet by 2030 are set to boost the battery production in India, which is a win-win for these two EV battery makers.
 Forget AC Stocks and Focus on These Companies Making Summer Products
May 4, 2024
These four non-AC stocks could be worth tracking this summer
 HDFC & Kotak Bank: DOUBLE or Trouble?
May 3, 2024
A critical look at Can HDFC and Kotak Bank stocks double your money?
 Multibagger Pharma Stock Announces Buyback at 25% Premium
May 3, 2024
This pharma stock greenlit its fourth buyback program in the last five years. Here's everything you need to know.
 Bulk Deal Alert: Shankar Sharma Sells 200,000 Shares of this Drone Stock
May 3, 2024
This decision by the superstar investor could prove costly as the drone company has strong growth levers in place.
 Why IFCI Share Price is Rising
May 3, 2024
This PSU company has turned a corner in FY24 by registering a profit after seven consecutive years of losses.
 A Simple Hack to Beat the Big Investors for Multibagger Gains
May 3, 2024
Forget the earnings season. Here's is a better metric that could offer interesting insights about stocks.
 Impending Rally in Indian Deep Tech Stocks?
May 2, 2024
Whether India's top tech stocks can leverage Government's US$ 1.2 Billion AI Fund...
 Aadhar Housing Finance IPO: A Promising Play on the Affordable Housing Boom
May 2, 2024
The Blackstone-backed company gears up for IPO. From grey market premium to price band, here's everything you need to know.
 Which Companies Build Metros and Vande Bharat Trains in India?
May 2, 2024
The biggest beneficiaries of the Indian railways' spending plan are...
 Why REC Share Price is Rising
May 2, 2024
The Navratna company has not added any new NPA in the last eight quarters, and it's aiming to be NPA free by the end of FY25.
 Why Kotak Mahindra Bank Share Price is Falling
May 2, 2024
Will RBI's regulatory embargo and multiple senior level exits, hurt Kotak Bank's profit growth?
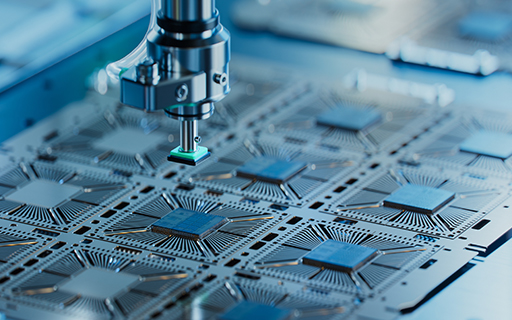 How to Invest in Indian Semiconductor Stocks
May 2, 2024
Is this the right time to invest in semiconductor stocks?
 5 Upcoming Renewable Energy IPOs to Watch Out
May 1, 2024
To capitalise on India's transition to a low carbon economy, these five PSU companies are set to launch the IPOs of their subsidiaries soon.
 Can IREDA Get to Zero Net NPAs Post Navratna Status?
May 1, 2024
Getting a 'Navratna' status gives the company's board and management much more autonomy and control on quick decision making.
 After Tata can This Business Group Create Wealth?
May 1, 2024
Aditya Birla Group announces multiple strategic decisions. How can you profit?
 Recycling Stocks are Booming. Here are 10 Stocks to Track Now
May 1, 2024
Keep an eye on these 10 top-performing recycling stocks leading the sustainability revolution.

