- Home
- Views On News
- Jul 7, 2022 - Nifty Trendline Suggests Breakout. But the Moving Average Can Act as a Hurdle
Nifty Trendline Suggests Breakout. But the Moving Average Can Act as a Hurdle
July 2022 has been the month of bulls so far. It broke the chain of bearish momentum which we witnessed in the months of May and June.
In the last two months, Indian share markets were falling.
Since 2001, the NSE Nifty hasn't closed on a negative note for four-straight months. So, can we have a positive close in July 2022?
Let's look at what the technical breakout says...
Nifty Daily Chart

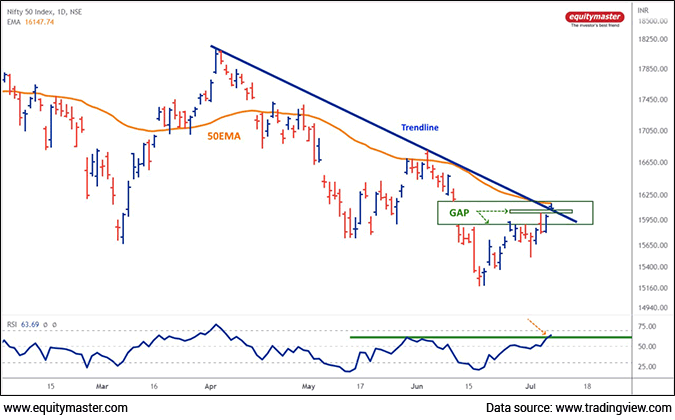
The Nifty has reversed from the lows of 15,183 and is trading above the key psychological level of 16,000 as I write this.
On the daily chart, the index has broken out of 3 months falling trendline with the gap in today's session.
But...
It resists at the short-term 50DEMA for over 2 months which is placed at 16,148.
Why is the 50DEMA important, you ask?
The index is trading below the Death Cross at present and the 50DEMA will act as a hurdle for bulls.
Additionally, the gap high of 16,172 needs to be taken out with strength.
The bullish range-shift on RSI is something in favor of bulls if we close above 16,100-mark today.
As I write this, the SGX Nifty live index is up 112 points to 16,100 level.
Meanwhile, the Nifty is trading at around 16,116, up by 126 points. Titan and M&M are the top gainers today.
If you're interested in being part of my charting journey as I share how to create wealth from the profitable trade setups, join my telegram channel - Fast Profits Daily. You'll get access to the best trading ideas in the stock market.
To know more about how the Nifty and Bank Nifty index are performing, please see the NSE Nifty Live Chart and NSE Bank Nifty long term chart.
Disclaimer: This article is for information purposes only. It is not a stock recommendation and should not be treated as such. Learn more about our recommendation services here...

Brijesh Bhatia Research Analyst and expert chartist, is the editor of Alpha Wave Profits. Fully committed to his craft, Brijesh has mastered the art of making money by trading using technical analysis. Brijesh has an MBA from ICFAI and 16 years of experience in India's financial markets. He began his career on Dalal Street as commodities dealer and it wasn't long before he developed his own unique trading system. Brijesh worked on his trading system until it could be expected to deliver 5 units of return for every unit of risk.


Equitymaster requests your view! Post a comment on "Nifty Trendline Suggests Breakout. But the Moving Average Can Act as a Hurdle". Click here!
Comments are moderated by Equitymaster, in accordance with the Terms of Use, and may not appear
on this article until they have been reviewed and deemed appropriate for posting.
In the meantime, you may want to share this article with your friends!