- Home
- Views On News
- Jul 31, 2023 - Tata Power Share Price is Rising. Is Now the Time to Buy?
Tata Power Share Price is Rising. Is Now the Time to Buy?
Tata Power share price showed significant strength on Friday last week, gaining over 6%. This surge indicates a powerful bullish move for the Tata group company.
Before delving into Tata Power's charts, it's important to note that the broader BSE Power index has also confirmed a bullish trend.
BSE Power Index Chart Analysis
The BSE Power index chart portrays a northward movement. It starts from the confluence of long-term horizontal support, the 200-week exponential moving average (WEMA), and the 50% Fibonacci retracement level.
Also, several chart patterns and indicators suggest that the bulls are in control of the trend, ending a prolonged consolidation period.
I recently made a video on power stocks and explained whether it's the right time to invest in the sector.
Tata Power Chart Analysis
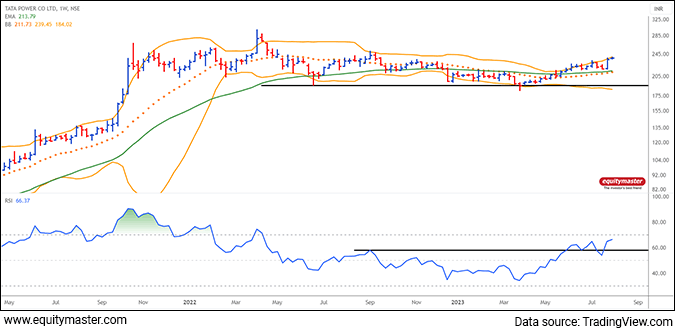
Multiple patterns are signalling the stock is breaking out of the consolidation zone. Bulls may take control of the trend for the medium term.

The stock exhibited accumulation above the 50-week exponential moving average (WEMA) depicted in green in the above chart.
This is a positive sign for Tata Power share price as it signifies increasing demand and investor interest.
The Shakeout
The horizontal trendline (shown in black), represents the previous swing low at Rs 190, serving as a crucial support zone.
In March 2023, the stock experienced a breach below this support level but remarkably reversed its direction sharply indicating a potential shakeout or breakdown failure.
The reversal presented a favourable opportunity for the bulls, as they took charge and successfully reclaimed the Rs 200 mark.
The swift recovery above the previous support level suggests a potential shift in sentiment and may signify renewed bullish momentum in the stock.
Bollinger Bands Expansion
The Bollinger Bands (orange), which represent the stock's volatility, witnessed an expansion after 38 weeks of remaining in a narrow band.
The breakout occurring after 38 weeks is considered strong, as it aligns with the Fibonacci time cycle theory. This indicates a potentially powerful and sustained price movement in the stock.
The Bollinger Band expansion strategy involves recognising periods of low volatility, where the Bollinger Bands contract, and anticipating potential price breakouts or significant price movements when the bands expand.
Once the Bollinger Bands expand, traders look for entry points to open positions in the direction of the breakout.
Bullish Range Shift on Relative Strength Index (RSI)
The Relative Strength Index (RSI) experienced a bullish range shift, further reinforcing the case for the bulls being in control of the trend.
A bullish range shift suggests increasing buying momentum and a positive outlook for the stock price.
Risk Parameters
While the current market sentiment appears to be strongly in favour of Tata Power, it is essential to consider the associated risks, especially with equity investments.
The bullish chart patterns will be invalidated if the weekly closing price falls below Rs 210. Such a scenario might indicate a potential reversal or weakening of the current bullish trend.
Conclusion
The broader BSE Power index chart signals a bullish trend, adding to the positive sentiment. Tata Power's stock price has entered a powerful bullish mode.
The specific chart patterns for Tata Power demonstrate the emergence of the bulls after a prolonged consolidation phase.
The accumulation above the 50-week exponential moving average, the Bollinger Bands expansion, and the bullish range shift on the RSI, all point towards the bulls being in control of the trend.
The bull case scenario for Tata Power will negate the weekly close below Rs 210.
Safe Stocks to Ride India's Lithium Megatrend
Lithium is the new oil. It is the key component of electric batteries.
There is a huge demand for electric batteries coming from the EV industry, large data centres, telecom companies, railways, power grid companies, and many other places.
So, in the coming years and decades, we could possibly see a sharp rally in the stocks of electric battery making companies.
If you're an investor, then you simply cannot ignore this opportunity.
Details of our SEBI Research Analyst registration are mentioned on our website - www.equitymaster.comDisclaimer: This article is for information purposes only. It is not a stock recommendation and should not be treated as such. Learn more about our recommendation services here...

Brijesh Bhatia Research Analyst and expert chartist, is the editor of Alpha Wave Profits. Fully committed to his craft, Brijesh has mastered the art of making money by trading using technical analysis. Brijesh has an MBA from ICFAI and 16 years of experience in India's financial markets. He began his career on Dalal Street as commodities dealer and it wasn't long before he developed his own unique trading system. Brijesh worked on his trading system until it could be expected to deliver 5 units of return for every unit of risk.
Equitymaster requests your view! Post a comment on "Tata Power Share Price is Rising. Is Now the Time to Buy?". Click here!
1 Responses to "Tata Power Share Price is Rising. Is Now the Time to Buy?"


Pratyush A Naik.
Jul 31, 2023Excellent analysis. Tata power should touch 250 in short term. Such sectoral analysis are very useful for positional trading. Brijeshji is doing very in depth analysis. Keep it up Brijeshji and EM Team.