
MEMBER'S LOGINX
| Invalid Username / Password | ||||||||
| Invalid Captcha | ||||||||
|
||||||||
| Sign Up | Forgot Password? | ||||||||
- Home
- Views On News
- Aug 4, 2023 - The Top 5 High ROCE Stocks Poised for Long Term Growth
The Top 5 High ROCE Stocks Poised for Long Term Growth

In the investing world, there are several accounting ratios that investors must get accustomed to.
Although all these ratios are important, one of the most talked about ratios is the return on capital employed (RoCE).
RoCE is the measure of how effectively a company is able to generate returns using its capital (debt and equity).
It is calculated by dividing earnings before interest and tax (EBIT) by capital employed. Where EBIT is the operating profit, and capital employed is the total capital invested (total equity + long-term debt).
RoCE = EBIT / Capital Employed
A high RoCE indicates that the company is using capital effectively to generate returns.
Now that you know the importance of RoCE, let's take a look at the top five Indian stocks with increasing RoCE.
We have shortlisted these companies using Equitymaster's powerful stock screener.
#1 Bayer CropScience
First on the list is Bayer CropScience.
It's the Indian subsidiary of Bayer AG, the world's largest pharmaceutical and life sciences company based out of Germany.
Ever since the 19th century, the company has been making significant contributions to India's agriculture and public health.
Bayer CropScience has three business divisions, namely crop science, pharmaceutical products, and consumer healthcare, of which crop science is the primary revenue driver.
Research and development (R&D) is at the core of its business. Hence it has set up four R&D sites across India. It is one of India's first agrochemical companies to get approval for drone-based spraying trails.
Over the past three years, the company's return ratios have improved substantially. Take a look at the table below.
Return Ratios of Bayer CropScience (2019-23)
| FY19 | FY20 | FY21 | FY22 | FY23 | |
|---|---|---|---|---|---|
| Return on capital employed (%) | 22.00% | 23.20% | 31.60% | 34.10% | 37.30% |
| Return on equity (%) | 15.10% | 18.40% | 19.30% | 25.60% | 28.00% |
| Return on assets (%) | 6.30% | 8.20% | 7.70% | 9.50% | 10.40% |
In the financial year 2023, the RoCE, return on equity (RoE) and return on assets (RoA) are all higher than its three-year average.
Healthy growth in profits has led to an increase in reserves and reduced the dependence on borrowed working capital, which led to an increase in return ratios.
The company's revenue has grown at a compound annual growth rate (CAGR) of 6.4% in the last three years on the back of high volume and value growth. The net profit also grew at a CAGR of 15.4% during the same time.
Being a debt-free company, there are hardly any outside financial obligations. This could be the reason why Bayer CropScience pays regular dividends to its shareholders.
The company has consistently increased its dividend payout over the last five years. In the financial year 2023, its dividend payout and dividend yield stood at 77.1%, and 2.7%, respectively.
Financial Snapshot of Bayer CropScience (2019-23)
| FY19 | FY20 | FY21 | FY22 | FY23 | |
|---|---|---|---|---|---|
| Revenue (Rs) | 32,207 | 36,761 | 43,272 | 47,943 | 52,126 |
| Growth (%) | 14.10% | 17.70% | 10.80% | 8.70% | |
| Net Profit (%) | 3,371 | 4,745 | 4,931 | 6,453 | 7,582 |
| Growth (%) | 40.80% | 3.90% | 30.90% | 17.50% | |
| Net Profit Margin (%) | 10.60% | 13.10% | 11.60% | 13.60% | 14.80% |
| Dividend Payout (%) | 18.30% | 23.70% | 104.80% | 104.50% | 77.10% |
| Dividend Yield (%) | 0.40% | 0.70% | 2.40% | 2.90% | 2.70% |
The growing need for food security and nutrition, increasing focus on crop quality, and increasing digitisation are driving the demand for agrochemical products. This will help Bayer CropScience grow its revenue and profit in the medium term.
To know more, check out Bayer Cropscience's financial factsheet and latest quarterly results.
#2 eClerx Services
Second on the list is eClerx Services.
Established in 2000, the company is India's first publicly listed company offering full-fledged knowledge process outsourcing (KPO) services.
From a small office in Mumbai, the company now employs over 15,000 people across India, the USA, the UK, Canada, Germany, Italy, Australia, the Philippines, the Netherlands, Singapore, and Thailand.
eClerx Services has a strategic approach to inorganic growth. It believes in acquisitions and has acquired several companies in the last two years, including Eclipse Global and Personiv, for US$ 68 million (m).
Previously it acquired CLX in 2015 and Agilyst in 2012. All its acquisitions proved to be useful, and the company plans to grow inorganically in the future as well.
In the last three years, the company's return ratios have improved consistently despite the blow to the Indian IT sector due to growing concerns of recession in the US.
Return Ratios of eClerx Services (2019-23)
| FY19 | FY20 | FY21 | FY22 | FY23 | |
|---|---|---|---|---|---|
| Return on capital employed (%) | 23.00% | 23.30% | 27.00% | 37.50% | 37.00% |
| Return on equity (%) | 16.80% | 16.20% | 19.00% | 26.80% | 29.80% |
| Return on assets (%) | 14.60% | 13.50% | 15.40% | 21.70% | 22.50% |
In the financial year 2023, the RoCE of the company was 37%, whereas its three-year average was 33.8%.
Strong revenue and profit growth are the primary reason behind good return ratios.
In the last three years, the revenue has grown at a CAGR of 19.3% on the back of high client demand for digitalisation. The net profit also grew at a CAGR of 20%.
The company also believes in repaying its shareholders through dividends and buybacks.
Financial Snapshot of eClerx Services (2019-23)
| FY19 | FY20 | FY21 | FY22 | FY23 | |
|---|---|---|---|---|---|
| Revenue (Rs) | 14,792 | 14,843 | 15,989 | 21,850 | 27,137 |
| Growth (%) | 0.30% | 7.70% | 36.70% | 24.20% | |
| Net Profit (%) | 2,283 | 2,090 | 2,828 | 4,178 | 4,888 |
| Growth (%) | -8.50% | 35.30% | 47.70% | 17.00% | |
| Net Profit Margin (%) | 16.00% | 14.50% | 18.10% | 19.30% | 18.00% |
| Dividend Payout (%) | 1.70% | 1.70% | 1.20% | 0.80% | 1.00% |
| Dividend Yield (%) | 0.10% | 0.10% | 0.10% | 0.04% | 0.04% |
Going forward, the company plans to invest in productised services strategy, BPaaS, analytics & automation, and onshore services.
To know more, check out eClerx Services' financial factsheet and latest quarterly results.
#3 Esab India
Next on the list is Esab India.
The company is a subsidiary of the Esab Group, owned by Colfax Corporation of USA, which is a leading provider of industrial pumps and other fluid-handling equipment.
Esab India is engaged in the production and distribution of welding and cutting products.
Its portfolio includes welding consumables, arc welding equipment, plasma, cutting automation, gas equipment, welding automation & robotics, digital solutions, and personal protective equipment (PPE) & accessories.
The company has grown through acquisitions ever since it was established. It acquired the welding business of Peico Electronics & Electricals, Indian Oxygen, Flotech Welding & Cutting Systems, and Maharashtra Weldaids in the past.
In the financial year 2023, the company spent Rs 319 million (m) on capex to enhance its manufacturing capacity, R&D, upgrade IT systems, and improve productivity.
The company has reported stellar financial performance in the last three years. Its revenue has grown at a CAGR of 16.7%, and the net profit grew at a CAGR of 31.8%.
The primary reason behind this growth is the high growth in volumes and cost-efficiency measures taken by the company.
Financial Snapshot of ESAB India (2019-23)
| FY19 | FY20 | FY21 | FY22 | FY23 | |
|---|---|---|---|---|---|
| Revenue (Rs) | 6,884 | 7,115 | 7,003 | 9,125 | 11,122 |
| Growth (%) | 3.40% | -1.60% | 30.30% | 21.90% | |
| Net Profit (%) | 576 | 714 | 593 | 843 | 1,357 |
| Growth (%) | 24.00% | -16.90% | 42.20% | 61.00% | |
| Net Profit Margin (%) | 8.60% | 10.20% | 8.60% | 9.30% | 12.30% |
| Dividend Payout (%) | 240.60% | 150.90% | 114.20% | 109.50% | 88.50% |
| Dividend Yield (%) | 11.10% | 5.50% | 2.90% | 2.20% | 2.10% |
As a result, the return ratios also improved. In the financial year 2023, the RoCE of the company was 70.2%, with a three-year average of 49.5%. The RoE and RoA also improved substantially and currently stand at 52.1% and 28.8%, respectively.
Return Ratios of ESAB India (2019-23)
| FY19 | FY20 | FY21 | FY22 | FY23 | |
|---|---|---|---|---|---|
| Return on capital employed (%) | 31.70% | 29,00% | 31.70% | 46.70% | 70.20% |
| Return on equity (%) | 21.60% | 21.10% | 22.90% | 34.50% | 52.10% |
| Return on assets (%) | 15.30% | 15.80% | 15.80% | 19.50% | 28.80% |
Esab India also pays consistent dividends to its shareholders and has a three-year average dividend payout and a dividend yield of 104.1% and 2.4%, respectively.
The company plans to improve its product portfolio by launching new products and increasing the share of its manufacturing revenue.
To know more, check out Esab India's financial factsheet and latest quarterly results.
#4 KSB
Fourth on the list is KSB.
The company is engaged in manufacturing a range of pumps, valves, systems, and control valves.
It fulfils the demand for several industries, including agriculture, construction, oil and gas, energy, and water treatment industries.
In the domestic pumps and valves market, KSB has a market share of around 13%.
In the current year (CY) 2022, the company reported the highest-ever sales of Rs 18.2 billion (bn) and the highest-ever order inflow of Rs 25 bn.
In the last three years, the revenue and net profit have grown at a CAGR of 14.6% and 24.9%, respectively, on account of healthy volume growth.
Financial Snapshot of KSB (2019-23)
| CY19 | CY20 | CY21 | CY22 | CY23 | |
|---|---|---|---|---|---|
| Revenue (Rs) | 11,131 | 13,155 | 12,371 | 15,310 | 18,641 |
| Growth (%) | 18.20% | -6.00% | 23.80% | 21.80% | |
| Net Profit (%) | 716 | 1,007 | 938 | 1,494 | 1,827 |
| Growth (%) | 40.60% | -6.90% | 59.30% | 22.30% | |
| Net Profit Margin (%) | 6.60% | 7.80% | 7.80% | 10.00% | 10.00% |
| Dividend Payout (%) | 29.20% | 27.60% | 31.50% | 29.10% | 28.60% |
| Dividend Yield (%) | 0.80% | 1.20% | 1.50% | 1.20% | 1.00% |
The company's return ratios have also improved significantly over the last three years.
Return Ratios of KSB (2019-23)
| CY19 | CY20 | CY21 | CY22 | CY23 | |
|---|---|---|---|---|---|
| Return on capital employed (%) | 14.90% | 17.60% | 18.00% | 20.40% | 22.00% |
| Return on equity (%) | 9.40% | 12.20% | 10.50% | 14.80% | 16.00% |
| Return on assets (%) | 6.10% | 7.40% | 6.30% | 9.60% | 10.30% |
Its latest RoCE is 22%, whereas the three-year average is 20.1%.
KSB also pays consistent dividends to its shareholders and has a five-year average dividend payout and dividend yield of 29.2% and 1.1%, respectively.
In CY 2022, the company localised the production of pumps for locomotives and railways, which were earlier manufactured by its parent company based in Germany.
KSB is also looking to launch new products to penetrate the solar power segment and cater to industries such as life science, navy and marine.
The company also plans to focus on aftermarket services and expand its product offerings to support its growth in the medium term.
Going forward, the company stands to benefit from capacity expansion plans of its user industries which will directly lead to an increase in its revenue.
To know more, check out KSB's financial factsheet and latest quarterly results.
#5 Grindwell Norton
Last on the list is Grindwell Norton, a subsidiary of the French multinational Saint Gobain group.
The company manufactures a range of technical products via its four business divisions. Some of its products include abrasives, ceramics, and plastics.
Its products find use in several industries, including steel, bearings, auto ancillaries, automobiles, jewellery, food processing, aerospace, and general engineering.
The company pioneered the manufacturing of grinding wheels which are used in industries to smooth out several types of surfaces. These grinding wheels are made out of abrasives, one of the primary products of the Grindwell Norton.
It is also a global leader in manufacturing geotextiles, a fabric made of polyester and has critical applications in coal mining and road reinforcement.
Over the last three years, the company's revenue has grown at a CAGR of 15.3% on account of healthy volume growth. The net profit also grew by a CAGR of 15% during the same period.
Financial Snapshot of Grindwell Norton (2019-23)
| FY19 | FY20 | FY21 | FY22 | FY23 | |
|---|---|---|---|---|---|
| Revenue (Rs) | 2,703 | 3,063 | 3,267 | 5,114 | 5,638 |
| Growth (%) | 13.30% | 6.70% | 56.50% | 10.20% | |
| Net Profit (%) | 151 | 181 | 249 | 511 | 583 |
| Growth (%) | 19.90% | 37.60% | 105.20% | 14.10% | |
| Net Profit Margin (%) | 5.60% | 6.00% | 7.70% | 10.10% | 10.30% |
| Dividend Payout (%) | 0.00% | 6.70% | 0.02% | 0.02% | 0.02% |
| Dividend Yield (%) | 0.00% | 1.30% | 0.00% | 0.00% | 0.10% |
As a result, the company's return ratios have improved substantially. The RoCE three years ago was 23.6% and currently stands at 27.5%. Similarly, its RoE and RoA have improved from 17.5% and 13% to 20.2% and 15.4% respectively.
Return Ratios of Grindwell Norton (2019-23)
| FY19 | FY20 | FY21 | FY22 | FY23 | |
|---|---|---|---|---|---|
| Return on capital employed (%) | 13.10% | 14.70% | 18.10% | 28.40% | 27.00% |
| Return on equity (%) | 8.10% | 9.00% | 11.00% | 18.40% | 21.00% |
| Return on assets (%) | 8.20% | 9.60% | 8.20% | 11.30% | 11.10% |
Grindwell Norton also pays consistent dividends to its shareholders. Its five-year average dividend payout and dividend yield are 43.6% and 1.1%, respectively.
In the financial year 2023, the company acquired PRS Permacel for a consideration of Rs 1.2 bn. Through this acquisition, it has entered the pressure-sensitive adhesive tape (PSAT) segment, which gives the company access to high-growth profitable markets such as electric vehicles (EV), railways, aerospace, defence and steel.
Going forward, the company's expansion plans are going to drive its revenue and profit growth in the medium term.
To know more, check out Grindwell Norton's financial factsheet and latest quarterly results.
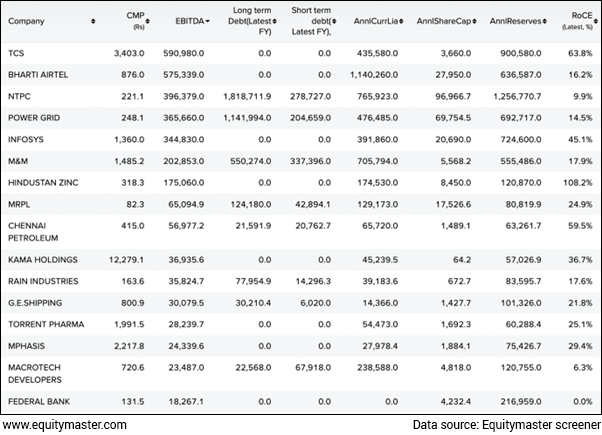
Snapshot of high ROCE stocks on Equitymaster's Indian stock screener
Here's a quick view of the above companies based on their financials.
Investing in companies with increasing return ratios
Consistently increasing RoCE indicates that the company is using its invested capital efficiently to generate healthy returns. It is also a useful indicator to compare companies in the same industry.
However, using only one metric, such as RoCE, to shortlist potential investments for your portfolio is not advisable.
When you look at a company, you must check all the parameters such as revenue and profit growth, free cashflows, surplus cash balance, dividend payout, brand reputation, management background, and future prospects.
By considering all these parameters, you can analyse a company better and pick the most viable opportunity for your portfolio.
Happy investing!
Safe Stocks to Ride India's Lithium Megatrend
Lithium is the new oil. It is the key component of electric batteries.
There is a huge demand for electric batteries coming from the EV industry, large data centres, telecom companies, railways, power grid companies, and many other places.
So, in the coming years and decades, we could possibly see a sharp rally in the stocks of electric battery making companies.
If you're an investor, then you simply cannot ignore this opportunity.
Details of our SEBI Research Analyst registration are mentioned on our website - www.equitymaster.comDisclaimer: This article is for information purposes only. It is not a stock recommendation and should not be treated as such. Learn more about our recommendation services here...
ABOUT EQUITYMASTER
Since 1996, Equitymaster has been the source for honest and credible opinions on investing in India. With solid research and in-depth analysis Equitymaster is dedicated towards making its readers- smarter, more confident and richer every day. Here's why hundreds of thousands of readers spread across more than 70 countries Trust Equitymaster.
PREMIUM PRODUCTS
QUICK LINKS
POPULAR TOPICS
- Multibagger Penny Stocks
- Basics of Value Investing
- Benjamin Graham
- How to Invest in Gold
- How to Invest in Silver
- Best Stocks to Buy Today
- Best Small-cap Stocks to Buy
- Best Bluechip Stocks to Buy
- Guide to Penny Stocks
- How to Invest in the Share Market
- Warren Buffett - The Value Investor
- Pick the Best Multibagger Stocks
TRENDING TOPICS
 Donate to credible NGOs in the sector of your choice (ii) Claim 50% tax benefit u/s 80G (iii) Receive periodic reports.")
Copyright © Equitymaster Agora Research Private Limited.
Whitelist | Refer | Terms | Privacy | Contact | About | Sitemap
Equitymaster Agora Research Private Limited (Research Analyst)
SEBI (Research Analysts) Regulations 2014, Registration No. INH000000537.
103, Regent Chambers, Above Status Restaurant, Nariman Point, Mumbai - 400 021. India.
Telephone: +91-22-61434055. Email: info@equitymaster.com. Website: www.equitymaster.com.
CIN:U74999MH2007PTC175407
Name of the Compliance & Grievance Officer: Ms Sonal Ramachandran
Telephone: +91-22-61434003 | Email: compliance@equitymaster.com
LEGAL DISCLAIMER:
Investment in securities market are subject to market risks. Read all the related documents carefully before investing.
Registration granted by SEBI and certification from NISM in no way guarantee performance of the intermediary or provide any assurance of returns to investors.
All rights reserved. Any act of copying, reproducing or distributing this newsletter whether wholly or in part, for any purpose without the permission of Equitymaster is strictly prohibited and shall be deemed to be copyright infringement.
Equitymaster Agora Research Private Limited (Research Analyst) bearing Registration No. INH000000537 (hereinafter referred as 'Equitymaster') is an independent equity research Company. Equitymaster is not an Investment Adviser. Information herein should be regarded as a resource only and should be used at one's own risk. This is not an offer to sell or solicitation to buy any securities and Equitymaster will not be liable for any losses incurred or investment(s) made or decisions taken/or not taken based on the information provided herein. Information contained herein does not constitute investment advice or a personal recommendation or take into account the particular investment objectives, financial situations, or needs of individual subscribers. Before acting on any recommendation, subscribers should consider whether it is suitable for their particular circumstances and, if necessary, seek an independent professional advice. This is not directed for access or use by anyone in a country, especially, USA, Canada or the European Union countries, where such use or access is unlawful or which may subject Equitymaster or its affiliates to any registration or licensing requirement. All content and information is provided on an 'As Is' basis by Equitymaster. Information herein is believed to be reliable but Equitymaster does not warrant its completeness or accuracy and expressly disclaims all warranties and conditions of any kind, whether express or implied. Equitymaster may hold shares in the company/ies discussed herein. As a condition to accessing Equitymaster content and website, you agree to our Terms and Conditions of Use, available here. The performance data quoted represents past performance and does not guarantee future results.
Equitymaster requests your view! Post a comment on "The Top 5 High ROCE Stocks Poised for Long Term Growth". Click here!
Comments are moderated by Equitymaster, in accordance with the Terms of Use, and may not appear
on this article until they have been reviewed and deemed appropriate for posting.
In the meantime, you may want to share this article with your friends!