
MEMBER'S LOGINX
| Invalid Username / Password | ||||||||
| Invalid Captcha | ||||||||
|
||||||||
| Sign Up | Forgot Password? | ||||||||
- Home
- Views On News
- Dec 6, 2022 - 5 Undervalued Midcap Stocks to Watch Out for in 2023
5 Undervalued Midcap Stocks to Watch Out for in 2023

Investing in midcap stocks can be one of the most rewarding ways to earn high returns while also taking on a little more risk.
To invest in midcaps, you need to look for companies with solid fundamentals and sustainable business models.
Another factor you need to consider is valuations. Undervalued stocks have time and again proven to be the safest options.
However, in a bullish market (like the present one), it often becomes very difficult to find undervalued stocks.
But if you dig deeper and have the patience, you'll find there are some pockets of undervalued stocks. These can be some great buys you can take advantage of.
If a leading daily is to be believed, then value investing has made a good comeback in 2022.
Mutual funds following the value style of investing, have done well in 2022, notching up returns in low-double digits. Value stocks like ITC, NTPC among others, have also delivered a market beating performance.
So 2022 turned out to be a good year for both value stocks as well as funds dedicated to this style of investing. We believe value investing will continue to outperform in 2023 as well.
With that in mind, let's take a look at five undervalued stocks from the midcap space.
We have selected the high-quality names which are trading at not so expensive valuations. These stocks have a price to earnings (PE) multiple between 20 and 50 and have low debt to equity.
This way, valuations are not very expensive and quality is also good as we are essentially considering zero debt companies.
#1 HDFC Asset Management Company (AMC)
First on the list is the HDFC group company - HDFC AMC.
HDFC AMC was started in 1999 and set up as a joint venture between Housing Development Finance Corporation (HDFC) and Standard Life Investments.
During financial year 2019, the company carried out an initial public offering (IPO) and became a publicly listed company in August 2018.
HDFC AMC offers a large suite of savings and investment products across asset classes. It also provides portfolio management and segregated account services to high net worth individuals (HNIs), family offices, domestic corporates, trusts, provident funds, and domestic and global institutions.
In the past five years, the company has grown its revenue at a modest rate of 4% on a compounded annual growth rate (CAGR) basis.
Profits have grown at a CAGR of 14% during the same period.
Return ratios for HDFC AMC are compelling with 5-year average return on equity (ROE) coming in at 33.4% while return on capital (ROCE) comes at 46.4%.
HDFC AMC has also declared hefty dividend for shareholders over the years.
Financial Snapshot of HDFC AMC
| Rs m, standalone | FY18 | FY19 | FY20 | FY21 | FY22 |
|---|---|---|---|---|---|
| Revenue | 17,568 | 19,152 | 20,033 | 18,525 | 21,154 |
| Growth (%) | 19% | 9% | 5% | -8% | 14% |
| Operating profit | 10,676 | 13,876 | 17,124 | 18,133 | 19,178 |
| OPM (%) | 61% | 72% | 85% | 98% | 91% |
| Net Profit | 7,113 | 9,306 | 12,624 | 13,258 | 13,931 |
| NPM (%) | 40% | 49% | 63% | 72% | 66% |
| Debt to equity (x) | 0.0 | 0.0 | 0.0 | 0.0 | 0.0 |
| ROE (%) | 38.8 | 35.1 | 35.6 | 30.2 | 27.3 |
| ROCE (%) | 57.6 | 51.6 | 46.8 | 39.9 | 36.2 |
| Dividend per share (Rs) | 16 | 24 | 28 | 34 | 42 |
Coming to valuations, HDFC AMC is currently trading at a price to earnings (PE) multiple of 33.75 and a price to book value (P/BV) of 8.7.
The stock is trading at a discount when compared to its historical average.
Valuation Ratios for HDFC AMC
| (x) | FY19 | FY20 | FY21 | FY22 | TTM |
|---|---|---|---|---|---|
| PE Ratio | 35.1 | 35.6 | 46.9 | 32.9 | 33.8 |
| P/BV Ratio | 10.7 | 11.2 | 13.1 | 8.4 | 8.7 |
| High PE | 54.5 | 68.0 | 56.1 | 51.4 | - |
| Low PE | 33.8 | 33.6 | 35.2 | 31.6 | - |
| Industry PE | 27.9 | ||||
| Industry P/BV | 6.1 | ||||
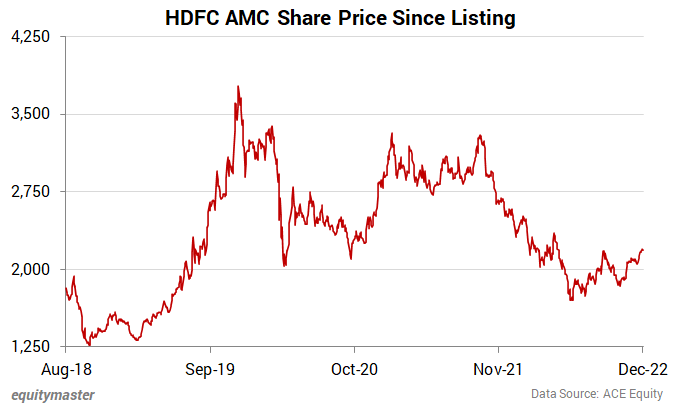
On the stock performance, HDFC AMC has fallen around 26% in 2022 so far. Its performance since listing isn't very noteworthy and has fluctuated largely at times.
#2 Supreme Industries
Next on the list is Supreme Industries.
The company is one of the leading manufacturers of plastic products in India.
With a comprehensive product portfolio, it has a presence in several business segments. Some of its key business verticals are the plastic piping division, packaging products, and consumer and industrial products.
Supreme Industries has 25 manufacturing facilities across the country, handling over 350,000 tonnes of polymers annually.
{inlinead2}In the past five years, the company has grown its revenue at a rate of 9% on a compounded annual growth rate (CAGR) basis.
Profits have grown at a CAGR of 18% during the same period.
The company's 5-year average return on equity (ROE) stands at 23.2% while return on capital (ROCE) stands at 31%.
Supreme Industries has also declared dividends at a growing rate.
Financial Snapshot of Supreme Industries
| Rs m, consolidated | FY18 | FY19 | FY20 | FY21 | FY22 |
|---|---|---|---|---|---|
| Revenue | 49,701 | 56,120 | 55,115 | 63,552 | 77,728 |
| Growth (%) | 11% | 13% | -2% | 15% | 22% |
| Operating profit | 7,969 | 7,999 | 8,455 | 13,011 | 12,621 |
| OPM (%) | 16% | 14% | 15% | 20% | 16% |
| Net Profit | 4,318 | 4,486 | 4,674 | 9,781 | 9,685 |
| NPM (%) | 9% | 8% | 8% | 15% | 12% |
| Debt to equity (x) | 0.13 | 0.08 | 0.18 | 0.00 | 0.00 |
| ROE (%) | 22.1 | 21.5 | 19.8 | 30.7 | 21.8 |
| ROCE (%) | 30.6 | 30.7 | 25.7 | 37.3 | 29.4 |
| Dividend per share (Rs) | 12 | 13 | 14 | 22 | 24 |
Coming to valuations, Supreme Industries is currently trading at a PE multiple of 44 and a price to book value of 9.2.
It has commanded such valuations in the past at peak levels. Its PE ratio at present is slightly above the industry average of 28.7x.
Valuation Ratios for Supreme Industries
| (x) | FY19 | FY20 | FY21 | FY22 | TTM |
|---|---|---|---|---|---|
| PE Ratio | 31.5 | 23.6 | 26.5 | 26.8 | 43.8 |
| P/BV Ratio | 6.6 | 4.9 | 8.2 | 6.8 | 9.2 |
| High PE | 41.7 | 38.5 | 48.4 | 29.5 | - |
| Low PE | 23.0 | 22.6 | 21.6 | 22.2 | - |
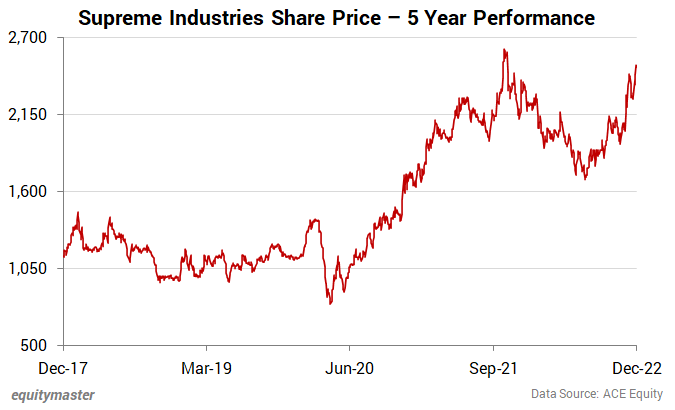
As far as stock performance is concerned, the share price has seen a run-up in recent weeks.
In 2021, the company announced a capex of Rs 8.5 billion (bn). It plans to establish three greenfield plants in India and expand existing plants' capacities.
Apart from capacity expansion, the company plans to increase the share of value-added products in its portfolio, which has a very high operating profit margin.
#3 CRISIL
Third on the list is rating agency CRISIL.
CRISIL is a leading innovative global analytics company driven by its mission of making markets function better. The company is India's foremost provider of ratings, data, research, analytics, and solutions.
A strong track record of growth, culture of innovation and global footprint sets the company apart from its competition. CRISIL is majority owned by S&P Global Inc, a leading provider of ratings worldwide.
In the past five years, the company has grown its revenue at a rate of 7% on a compounded annual growth rate (CAGR) basis.
Profits have grown at a CAGR of 9% during the same period.
The company's 5-year average return on equity (ROE) stands at 33% while return on capital (ROCE) stands at 42.5%.
CRISIL has been a consistent dividend payer for nearly two decades.
Financial Snapshot of CRISIL
| Rs m, consolidated | CY17 | CY18 | CY19 | CY20 | CY21 |
|---|---|---|---|---|---|
| Revenue | 16,585 | 17,485 | 17,317 | 19,818 | 23,007 |
| Growth (%) | 7% | 5% | -1% | 14% | 16% |
| Operating profit | 4,807 | 5,446 | 5,287 | 5,938 | 6,875 |
| OPM (%) | 29% | 31% | 31% | 30% | 30% |
| Net Profit | 3,044 | 3,631 | 3,440 | 3,547 | 4,658 |
| NPM (%) | 18% | 21% | 20% | 18% | 20% |
| Debt to equity (x) | 0.0 | 0.0 | 0.0 | 0.0 | 0.0 |
| ROE (%) | 32.0 | 35.4 | 31.6 | 30.0 | 33.4 |
| ROCE (%) | 42.7 | 45.9 | 42.5 | 38.0 | 43.4 |
| Dividend per share (Rs) | 28 | 30 | 32 | 33 | 46 |
Coming to valuations, CRISIL is currently trading at a PE multiple of 55 and a price to book value of 21.2.
Historically, credit rating agencies have been known to trade at steep valuations on the back of oligopolistic market, asset-light nature of the business, limited capex requirement, and strong operating cash flows.
Their incremental profit growth and good deployment of cash leads to healthy return ratios. Dividend payout is also on the higher side for these firms.
Valuation Ratios for CRISIL
| (x) | CY18 | CY19 | CY20 | CY21 | TTM |
|---|---|---|---|---|---|
| PE Ratio | 32.2 | 40.2 | 39.4 | 45.2 | 55.0 |
| P/BV Ratio | 10.9 | 12.5 | 11.1 | 13.7 | 21.0 |
| High PE | 47.1 | 40.2 | 44.1 | 60.7 | - |
| Low PE | 28.4 | 23.8 | 24.0 | 36.4 | - |
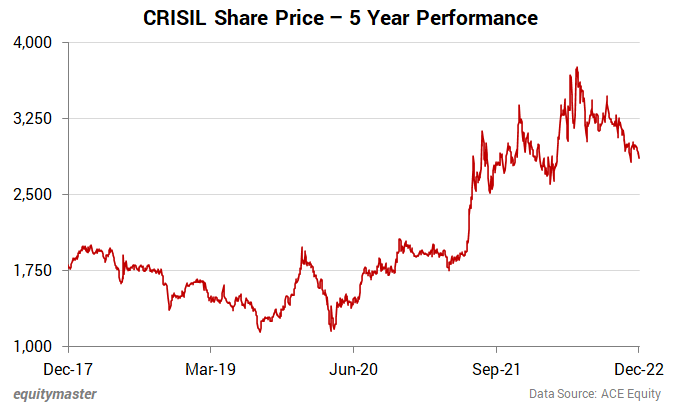
On the stock performance, the company has gained 58% over the past five years.
#4 Bayer Cropscience
Next, we have an agrochemical company with a marketcap of Rs 213.4 bn, Bayer Cropscience.
Bayer Cropscience is an Indian subsidiary of Bayer AG, world's largest pharmaceutical and life sciences company based out of Germany.
The company's association with India dates back to the 19th century. Since then, it continues to make significant contributions to India's agriculture and public health.
It provides various products and services through its 3 business divisions: Crop science, pharmaceutical products, and consumer healthcare.
In the past five years, the company has grown its revenue at a rate of 12% on a CAGR basis.
Profits have grown at a CAGR of 17% during the same period.
The company's 5-year average ROE stands at 19% while ROCE stands at 27.2%.
Bayer has paid hefty dividends in the past two years and could continue this dividend payout in the coming years.
Financial Snapshot of Bayer
| Rs m, standalone | FY18 | FY19 | FY20 | FY21 | FY22 |
|---|---|---|---|---|---|
| Revenue | 27,099 | 31,673 | 36,094 | 42,613 | 47,344 |
| Growth (%) | -3% | 17% | 14% | 18% | 11% |
| Operating profit | 4,482 | 5,342 | 7,924 | 8,755 | 8,657 |
| OPM (%) | 17% | 17% | 22% | 21% | 18% |
| Net Profit | 3,001 | 3,371 | 4,745 | 4,931 | 6,453 |
| NPM (%) | 11% | 11% | 13% | 12% | 14% |
| Debt to equity (x) | 0.0 | 0.0 | 0.0 | 0.0 | 0.0 |
| ROE (%) | 15.7 | 16.8 | 19.8 | 19.3 | 25.4 |
| ROCE (%) | 21.7 | 24.4 | 24.8 | 31.5 | 33.9 |
| Dividend per share (Rs) | 18 | 18 | 25 | 115 | 150 |
As far as valuations are concerned, Bayer Cropscience is currently trading at a PE multiple of 29.6 and a price to book multiple of 7 times.
In most of its previous years, the company has commanded a higher valuation than the current levels. The industry PE is 33.8x.
Valuation Ratios of Bayer
| (x) | FY19 | FY20 | FY21 | FY22 | TTM |
|---|---|---|---|---|---|
| PE Ratio | 44.6 | 32.7 | 48.3 | 34.7 | 29.6 |
| P/BV Ratio | 6.8 | 6.0 | 9.3 | 8.9 | 7.2 |
| High PE | 54.3 | 54.9 | 56.8 | 56.1 | - |
| Low PE | 39.5 | 32.8 | 30.3 | 34.7 | - |
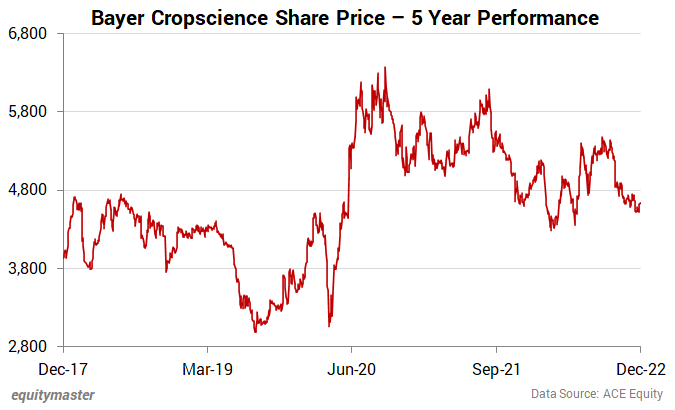
On the stock performance, in 2022 so far, Bayer Cropscience has fallen 6% while it has gained 18% over the past five years.
#5 Bosch
Last on the list we have auto-ancillary company Bosch.
The company is a leading supplier of technology and services in the areas of mobility solutions, industrial technology, consumer goods, energy, and building technology in India.
Additionally, it has the largest development center outside Germany, for end to end engineering and technology solutions.
Financials of Bosch have fluctuated to a great deal in the pandemic years which has had an impact on the long-term averages. Revenues currently stand at same levels where they were five years ago while profit has declined marginally.
The company's 5-year average ROE stands at 11% while ROCE stands at 16%.
The company has a history of paying dividends since 1994 and a growing track record at that.
Financial Snapshot of Bayer
| Rs m, consolidated | FY18 | FY19 | FY20 | FY21 | FY22 |
|---|---|---|---|---|---|
| Revenue | 116,901 | 122,578 | 98,416 | 97,162 | 117,816 |
| Growth (%) | 4% | 5% | -20% | -1% | 21% |
| Operating profit | 26,050 | 27,565 | 20,299 | 16,646 | 18,531 |
| OPM (%) | 22% | 22% | 21% | 17% | 16% |
| Net Profit | 13,711 | 15,983 | 6,495 | 4,820 | 12,183 |
| NPM (%) | 12% | 13% | 7% | 5% | 10% |
| Debt to equity (x) | 0.0 | 0.0 | 0.0 | 0.0 | 0.0 |
| ROE (%) | 14.6 | 16.7 | 6.4 | 5.0 | 11.9 |
| ROCE (%) | 21.8 | 24.7 | 10.1 | 6.1 | 14.9 |
| Dividend per share (Rs) | 100 | 105 | 105 | 115 | 210 |
On the valuations front, Bosch currently trades at a PE multiple of 39 and a price to book multiple of 4.7.
Valuations for Bosch
| (x) | FY19 | FY20 | FY21 | FY22 | TTM |
|---|---|---|---|---|---|
| PE Ratio | 33.5 | 42.7 | 86.2 | 35.0 | 39.0 |
| P/BV Ratio | 5.9 | 3.0 | 4.2 | 4.0 | 4.7 |
| High PE | 49.0 | 46.3 | 618.1 | 97.4 | - |
| Low PE | 38.4 | 25.4 | 40.1 | 30.4 | - |
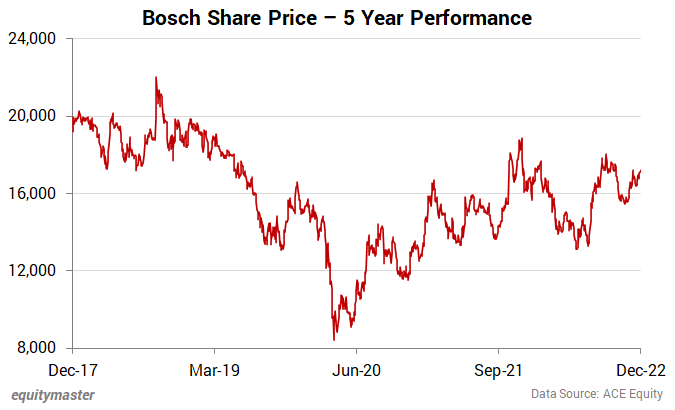
As far as stock performance is concerned, the company has underperformed big time in the past five years and in 2022.
It has fallen 14% in five-year period and 1% in 2022 so far.
Screen undervalued stocks using Equitymaster's Indian Stock Screener
You can shortlist undervalued stocks across categories in just a few seconds using Equitymaster's Indian stock screener.
It's a powerful and flexible tool which allows you to run your own custom queries.
Here are some of the valuations screens that should help you get started in the world of value investing.
- Most Undervalued Stocks in India
- Top Value Stocks in India
- Low Price to Book Stocks in India
- Low PE Smallcap Stocks in India
Equitymaster's valuation guru and Co-head of Research, Rahul Shah, recorded a video some months ago explaining how to use the most important valuation metric - PE ratio, like a pro.
Safe Stocks to Ride India's Lithium Megatrend
Lithium is the new oil. It is the key component of electric batteries.
There is a huge demand for electric batteries coming from the EV industry, large data centres, telecom companies, railways, power grid companies, and many other places.
So, in the coming years and decades, we could possibly see a sharp rally in the stocks of electric battery making companies.
If you're an investor, then you simply cannot ignore this opportunity.
Details of our SEBI Research Analyst registration are mentioned on our website - www.equitymaster.comDisclaimer: This article is for information purposes only. It is not a stock recommendation and should not be treated as such. Learn more about our recommendation services here...

Yash Vora is a financial writer with the Microcap Millionaires team at Equitymaster. He has followed the stock markets right from his early college days. So, Yash has a keen eye for the big market movers. His clear and crisp writeups offer sharp insights on market moving stocks, fund flows, economic data and IPOs. When not looking at stocks, Yash loves a game of table tennis or chess.
ABOUT EQUITYMASTER
Since 1996, Equitymaster has been the source for honest and credible opinions on investing in India. With solid research and in-depth analysis Equitymaster is dedicated towards making its readers- smarter, more confident and richer every day. Here's why hundreds of thousands of readers spread across more than 70 countries Trust Equitymaster.
PREMIUM PRODUCTS
QUICK LINKS
POPULAR TOPICS
- Multibagger Penny Stocks
- Basics of Value Investing
- Benjamin Graham
- How to Invest in Gold
- How to Invest in Silver
- Best Stocks to Buy Today
- Best Small-cap Stocks to Buy
- Best Bluechip Stocks to Buy
- Guide to Penny Stocks
- How to Invest in the Share Market
- Warren Buffett - The Value Investor
- Pick the Best Multibagger Stocks
TRENDING TOPICS
 Donate to credible NGOs in the sector of your choice (ii) Claim 50% tax benefit u/s 80G (iii) Receive periodic reports.")
Copyright © Equitymaster Agora Research Private Limited.
Whitelist | Refer | Terms | Privacy | Contact | About | Sitemap
Equitymaster Agora Research Private Limited (Research Analyst)
SEBI (Research Analysts) Regulations 2014, Registration No. INH000000537.
103, Regent Chambers, Above Status Restaurant, Nariman Point, Mumbai - 400 021. India.
Telephone: +91-22-61434055. Email: info@equitymaster.com. Website: www.equitymaster.com.
CIN:U74999MH2007PTC175407
Name of the Compliance & Grievance Officer: Ms Sonal Ramachandran
Telephone: +91-22-61434003 | Email: compliance@equitymaster.com
LEGAL DISCLAIMER:
Investment in securities market are subject to market risks. Read all the related documents carefully before investing.
Registration granted by SEBI and certification from NISM in no way guarantee performance of the intermediary or provide any assurance of returns to investors.
All rights reserved. Any act of copying, reproducing or distributing this newsletter whether wholly or in part, for any purpose without the permission of Equitymaster is strictly prohibited and shall be deemed to be copyright infringement.
Equitymaster Agora Research Private Limited (Research Analyst) bearing Registration No. INH000000537 (hereinafter referred as 'Equitymaster') is an independent equity research Company. Equitymaster is not an Investment Adviser. Information herein should be regarded as a resource only and should be used at one's own risk. This is not an offer to sell or solicitation to buy any securities and Equitymaster will not be liable for any losses incurred or investment(s) made or decisions taken/or not taken based on the information provided herein. Information contained herein does not constitute investment advice or a personal recommendation or take into account the particular investment objectives, financial situations, or needs of individual subscribers. Before acting on any recommendation, subscribers should consider whether it is suitable for their particular circumstances and, if necessary, seek an independent professional advice. This is not directed for access or use by anyone in a country, especially, USA, Canada or the European Union countries, where such use or access is unlawful or which may subject Equitymaster or its affiliates to any registration or licensing requirement. All content and information is provided on an 'As Is' basis by Equitymaster. Information herein is believed to be reliable but Equitymaster does not warrant its completeness or accuracy and expressly disclaims all warranties and conditions of any kind, whether express or implied. Equitymaster may hold shares in the company/ies discussed herein. As a condition to accessing Equitymaster content and website, you agree to our Terms and Conditions of Use, available here. The performance data quoted represents past performance and does not guarantee future results.
Equitymaster requests your view! Post a comment on "5 Undervalued Midcap Stocks to Watch Out for in 2023". Click here!
Comments are moderated by Equitymaster, in accordance with the Terms of Use, and may not appear
on this article until they have been reviewed and deemed appropriate for posting.
In the meantime, you may want to share this article with your friends!