- Home
- Views On News
- May 25, 2023 - Can Bajaj Auto and TVS Motors Continue to Outperform
Can Bajaj Auto and TVS Motors Continue to Outperform
The Indian automobile sector has been witnessing an interesting trend in recent times, particularly, the two-wheeler segment.
Bajaj Auto and TVS Motors, two leading players in the market, have experienced a remarkable surge in their stock prices, propelling them to their 52-week high levels.
This impressive performance has not only caught the attention of investors but has also contributed to the outperformance of the Nifty Auto Index.
As these companies continue to gain market share and expand their product portfolios, the overall growth potential for the Nifty Auto Index is expected to remain positive.
The surge in stock prices of these key players reflects the market's confidence in their strategies and growth prospects.
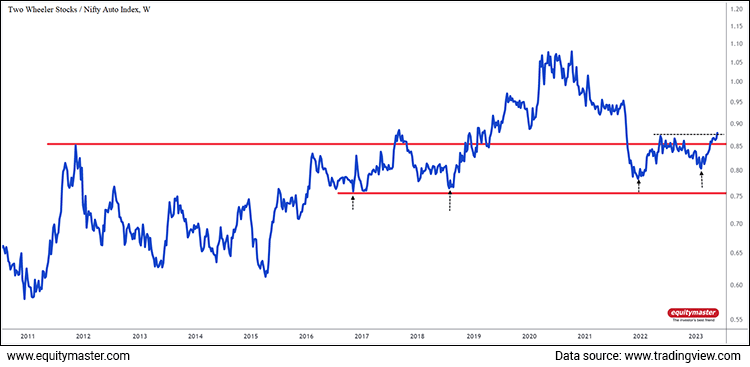
Two Wheelers Stocks / Nifty Auto Index Ratio Chart

Bajaj Auto and TVS Motors are trading at 52-week highs of Rs 4,650 and Rs 1,279.9 respectively.
We checked the performance of two-wheelers stocks against the Nifty Auto index. We plotted the ratio chart of the two-wheelers stocks to the Nifty Auto Index.
Ratio charts are a valuable tool used in financial analysis to compare the performance of two or more variables relative to each other.
Rather than focusing solely on the absolute values of individual variables, ratio charts allow analysts to examine the relationship and relative strength between different assets, sectors, or indices.
These charts provide insights into trends, divergences, and patterns that may not be readily apparent when looking at individual data series.
A ratio chart heading northwards means the numerator is outperforming and vice versa.
In the chart above, the ratio going higher means an outperformance of two-wheelers stocks over the Nifty Auto index.
The constituents of two-wheelers stocks are Bajaj Auto, TVS Motors, Hero Moto, and Eicher Motors.
On the chart, the range of horizontal trendlines (red) is indicating an accumulation zone which means its time to accumulate two-wheeler stocks.
The higher low marked by black arrows signals the long-term bullish trend. The recent breakout from the previous swing high confirms the resumption of the outperformance of two-wheelers stocks.
The soaring stock prices of Bajaj Auto and TVS Motors, leading to their 52-week high levels, are a testament to their strong performance and market position.
The outperformance of the two-wheeler segment within the Nifty Auto Index highlights their growth potential and resilience.
As these companies continue to innovate, diversify their product portfolios, and tap into emerging trends such as electric mobility, they are well-positioned to capitalise on evolving consumer preferences and maintain their upward growth trajectory.
Disclaimer: This article is for information purposes only. It is not a stock recommendation and should not be treated as such. Learn more about our recommendation services here...

Brijesh Bhatia Research Analyst and expert chartist, is the editor of Alpha Wave Profits. Fully committed to his craft, Brijesh has mastered the art of making money by trading using technical analysis. Brijesh has an MBA from ICFAI and 16 years of experience in India's financial markets. He began his career on Dalal Street as commodities dealer and it wasn't long before he developed his own unique trading system. Brijesh worked on his trading system until it could be expected to deliver 5 units of return for every unit of risk.


Equitymaster requests your view! Post a comment on "Can Bajaj Auto and TVS Motors Continue to Outperform". Click here!
Comments are moderated by Equitymaster, in accordance with the Terms of Use, and may not appear
on this article until they have been reviewed and deemed appropriate for posting.
In the meantime, you may want to share this article with your friends!