
MEMBER'S LOGINX
| Invalid Username / Password | ||||||||
| Invalid Captcha | ||||||||
|
||||||||
| Sign Up | Forgot Password? | ||||||||
- Home
- Views On News
- Jun 13, 2023 - SRF Share Price: Bullish Momentum Abruptly Gives Way to Bearish Rout
SRF Share Price: Bullish Momentum Abruptly Gives Way to Bearish Rout
SRF share price plummeted a staggering 10% in just three trading sessions on the National Stock Exchange (NSE), plunging from Rs 2,576 to Rs 2,320.
SRF Daily Price Chart
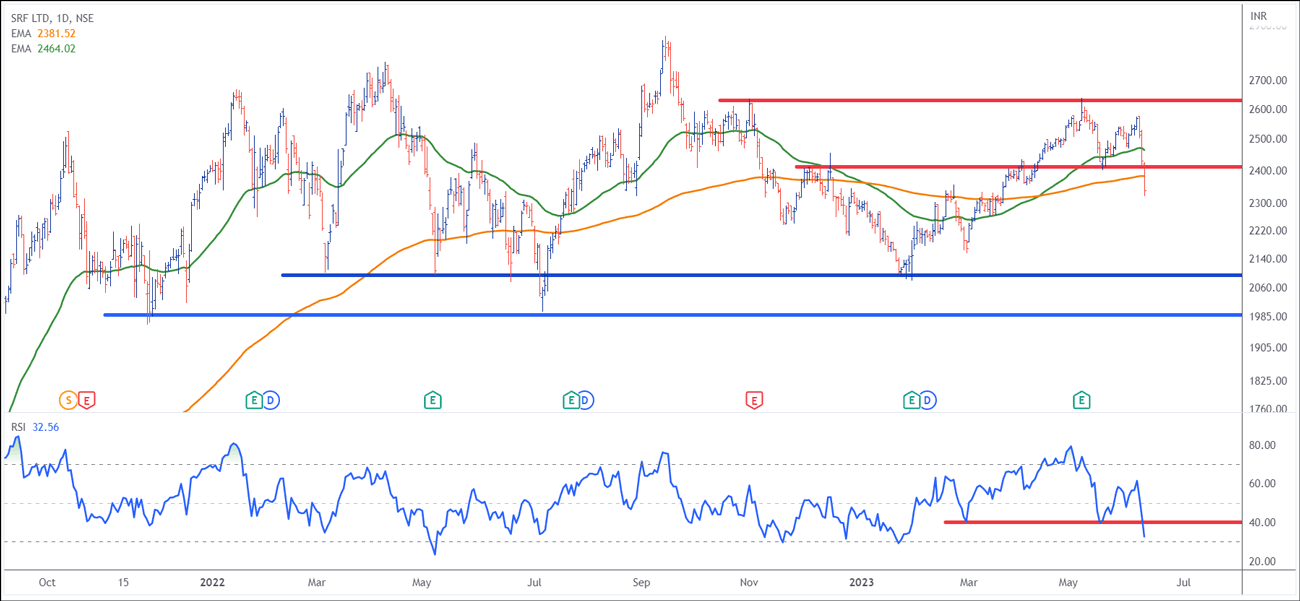
Decoding the Chart Patterns...
On the daily chart, a significant shift from a bullish to a bearish trend is visible as the stock broke through both the support zone (marked red) and the rising trendline (marked black).
However, the medium-term and long-term trends remain bullish, with a potential support zone acting as a key factor.
Additionally, although the price is currently trading below the 200-day exponential moving average (200 DEMA), a death cross has not been confirmed.
Short-Term Trend
The short-term chart of SRF indicates a notable change in the prevailing trend. The support zone, highlighted in red, has been breached, indicating a weakening of bullish momentum.
Additionally, the stock has also broken below the black rising trendline, confirming the shift towards a bearish outlook.
The short-term bearish breakdown is substantiated by a bearish range shift observed on the Relative Strength Index (RSI).
Medium-Term and Long-Term Trends
Despite the bearish developments on the short-term chart, the medium-term and long-term trends for SRF remain bullish.
The support zone of Rs 1,975 to Rs 2,100 (trendline marked in blue) plays a crucial role in maintaining the overall positive trend.
This support zone has not been violated. This suggests it could provide a significant level of support to prevent further downside pressure.
The 200 DEMA at play
It's worth noting that the stock price is currently trading below the 200 Day Exponential Moving Average (200 DEMA), which is often considered a bearish signal.
It's important to highlight that a death cross that typically indicates a more prolonged bearish period, has not yet occurred.
This suggests that while the short-term outlook has turned bearish, the long-term trend may still have the potential for recovery.
Conclusion
In summary, the short-term chart reveals a significant shift from a bullish to a bearish trend. The break of the support zone and the rising trendline are strong indications of weakening momentum.
The medium-term and long-term trends remain bullish, supported by the unbroken support zone of 1,975-2,100. While the stock is currently trading below the 200 DEMA, a death cross has not been confirmed.
Traders should closely monitor the price action and further developments to determine if the bearish trend continues or if a potential recovery takes place in the medium to long term.
Today, SRF share price opened the day at Rs 2,357 against its previous close of Rs 2,338.
It has a 52-week high of Rs 2,864 touched last year in September 2022 and a 52-week low price of Rs 2,002 touched on 6 July 2022.
If you're interested in being part of my charting journey, join my telegram channel - Fast Profits Daily. You'll get access to the best trading ideas in the stock market.
Disclaimer: This article is for information purposes only. It is not a stock recommendation and should not be treated as such. Learn more about our recommendation services here...

Brijesh Bhatia Research Analyst and expert chartist, is the editor of Alpha Wave Profits. Fully committed to his craft, Brijesh has mastered the art of making money by trading using technical analysis. Brijesh has an MBA from ICFAI and 16 years of experience in India's financial markets. He began his career on Dalal Street as commodities dealer and it wasn't long before he developed his own unique trading system. Brijesh worked on his trading system until it could be expected to deliver 5 units of return for every unit of risk.
ABOUT EQUITYMASTER
Since 1996, Equitymaster has been the source for honest and credible opinions on investing in India. With solid research and in-depth analysis Equitymaster is dedicated towards making its readers- smarter, more confident and richer every day. Here's why hundreds of thousands of readers spread across more than 70 countries Trust Equitymaster.
PREMIUM PRODUCTS
QUICK LINKS
POPULAR TOPICS
- Multibagger Penny Stocks
- Basics of Value Investing
- Benjamin Graham
- How to Invest in Gold
- How to Invest in Silver
- Best Stocks to Buy Today
- Best Small-cap Stocks to Buy
- Best Bluechip Stocks to Buy
- Guide to Penny Stocks
- How to Invest in the Share Market
- Warren Buffett - The Value Investor
- Pick the Best Multibagger Stocks
TRENDING TOPICS
 Donate to credible NGOs in the sector of your choice (ii) Claim 50% tax benefit u/s 80G (iii) Receive periodic reports.")
Copyright © Equitymaster Agora Research Private Limited.
Whitelist | Refer | Terms | Privacy | Contact | About | Sitemap
Equitymaster Agora Research Private Limited (Research Analyst)
SEBI (Research Analysts) Regulations 2014, Registration No. INH000000537.
103, Regent Chambers, Above Status Restaurant, Nariman Point, Mumbai - 400 021. India.
Telephone: +91-22-61434055. Email: info@equitymaster.com. Website: www.equitymaster.com.
CIN:U74999MH2007PTC175407
Name of the Compliance & Grievance Officer: Ms Sonal Ramachandran
Telephone: +91-22-61434003 | Email: compliance@equitymaster.com
LEGAL DISCLAIMER:
Investment in securities market are subject to market risks. Read all the related documents carefully before investing.
Registration granted by SEBI and certification from NISM in no way guarantee performance of the intermediary or provide any assurance of returns to investors.
All rights reserved. Any act of copying, reproducing or distributing this newsletter whether wholly or in part, for any purpose without the permission of Equitymaster is strictly prohibited and shall be deemed to be copyright infringement.
Equitymaster Agora Research Private Limited (Research Analyst) bearing Registration No. INH000000537 (hereinafter referred as 'Equitymaster') is an independent equity research Company. Equitymaster is not an Investment Adviser. Information herein should be regarded as a resource only and should be used at one's own risk. This is not an offer to sell or solicitation to buy any securities and Equitymaster will not be liable for any losses incurred or investment(s) made or decisions taken/or not taken based on the information provided herein. Information contained herein does not constitute investment advice or a personal recommendation or take into account the particular investment objectives, financial situations, or needs of individual subscribers. Before acting on any recommendation, subscribers should consider whether it is suitable for their particular circumstances and, if necessary, seek an independent professional advice. This is not directed for access or use by anyone in a country, especially, USA, Canada or the European Union countries, where such use or access is unlawful or which may subject Equitymaster or its affiliates to any registration or licensing requirement. All content and information is provided on an 'As Is' basis by Equitymaster. Information herein is believed to be reliable but Equitymaster does not warrant its completeness or accuracy and expressly disclaims all warranties and conditions of any kind, whether express or implied. Equitymaster may hold shares in the company/ies discussed herein. As a condition to accessing Equitymaster content and website, you agree to our Terms and Conditions of Use, available here. The performance data quoted represents past performance and does not guarantee future results.
Equitymaster requests your view! Post a comment on "SRF Share Price: Bullish Momentum Abruptly Gives Way to Bearish Rout". Click here!
Comments are moderated by Equitymaster, in accordance with the Terms of Use, and may not appear
on this article until they have been reviewed and deemed appropriate for posting.
In the meantime, you may want to share this article with your friends!