
MEMBER'S LOGINX
| Invalid Username / Password | ||||||||
| Invalid Captcha | ||||||||
|
||||||||
| Sign Up | Forgot Password? | ||||||||
- Home
- Views On News
- Aug 10, 2023 - Lupin: The Next Big Breakout?
Lupin: The Next Big Breakout?
Lupin is a large Indian pharmaceutical company headquartered in Mumbai.
With a rich history over five decades, Lupin has established itself as a global player in the industry. The company's focus areas are research, development, manufacturing, and marketing of a wide range of generic and branded pharmaceutical products.
Through its robust distribution network, it serves patients in over 100 countries, providing affordable drugs.
In this article, we will discuss the technical chart set up of the company's stock.
Technical View
Lupin Weekly Chart
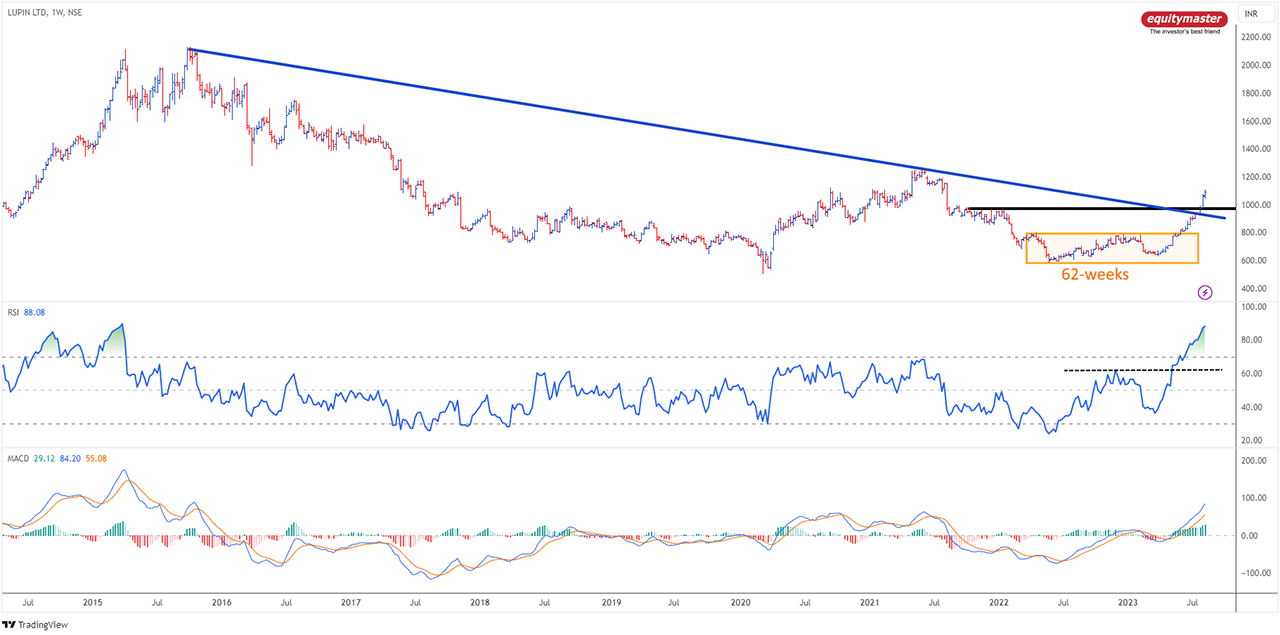
In the weekly chart above, the stock has broken out from a basing pattern of 62 weeks with a bullish range shift in the Relative Strength Index (RSI) and a positive crossover on the Moving Average Convergence Divergence (MACD) indicator.
Following the post-pandemic recovery in the pharma sector, the stock rallied, but the momentum proved to be short-lived, reaching a peak in May 2021.
The stock reversed and witnessed a declined significantly by over 50% but managed to hold the pandemic low at Rs 495.
Finally, the stock price breakout from the consolidation zone after 62 weeks. This breakout signifies a shift in market sentiment and a start of a new bullish phase.
The breakout from the basing pattern indicates a change in the supply-demand dynamics and can lead to significant price movements.
The duration of 62 weeks holds significance in the Fibonacci time cycle, which is derived from the Fibonacci sequence.
As 61.80% is the golden ratio as per the Fibonacci theory, the breakout from the 62-week time cycle theory adds weight to the breakout of price and time.
The Dow Theory has highlighted a promising shift towards a bullish sentiment. This is characterised by the emergence of a higher high - higher low structure.
This pattern indicates upward momentum. It has been notably validated by key breakouts at both the 800 and 1,000 levels. These confirmatory breakthroughs serve to solidify the notion of a bullish reversal.
This pattern instils optimism among traders and reflects a potential shift in market sentiment.
The breakout from the descending trendline serves as a crucial confirmation layer for the prevailing bullish momentum in the stock.
This significant breach of the trendline not only validates the upward movement but also provides a tangible signal of a potential trend reversal.
As the stock surpasses this technical barrier, it adds a heightened level of assurance to the ongoing bullish sentiment. This enhances the credibility of the upward trajectory and bolsters investor confidence.
The price breakout on the charts is accompanied by indicators such as RSI and MACD, which are signalling strength in the breakout.
The Relative Strength Index (RSI) is a popular momentum oscillator used to assess the strength of price movements. A bullish range shift in the RSI indicates that the buying pressure is increasing, suggesting a potential continuation of the bullish trend.
Also, a positive crossover has occurred on the MACD where the signal line has crossed above the MACD line. This crossover is seen as a bullish signal and confirms the reversal in the stock.
Risk
When the Relative Strength Index (RSI) trends within the overbought zone, certain risk parameters come into play. This zone, typically marked by an RSI value above 70, points to an overextended price movement and a high probability of a price correction.
Investors need to exercise caution as this situation may indicate that the asset is trading above its perceived intrinsic value.
While it doesn't necessarily imply an immediate reversal, it does suggest a higher likelihood of a pullback or consolidation.
The recent technical breakout in the stock, aligned with the time cycle theory, strongly suggests a reversal in the prevailing trend. However, the cautionary presence of an overbought Relative Strength Index (RSI) suggests a potential retest of the breakout.
The retest of breakout can present an opportunity for investors to strategically implement a "buy-on-dips" strategy.
By capitalising on price pullbacks that may occur due to the overbought conditions, investors can position themselves advantageously.
They could enter the stock at more favourable price points, thereby improving their potential gains while mitigating risks of an overextended price movement.

Brijesh Bhatia Research Analyst and expert chartist, is the editor of Alpha Wave Profits. Fully committed to his craft, Brijesh has mastered the art of making money by trading using technical analysis. Brijesh has an MBA from ICFAI and 16 years of experience in India's financial markets. He began his career on Dalal Street as commodities dealer and it wasn't long before he developed his own unique trading system. Brijesh worked on his trading system until it could be expected to deliver 5 units of return for every unit of risk.
ABOUT EQUITYMASTER
Since 1996, Equitymaster has been the source for honest and credible opinions on investing in India. With solid research and in-depth analysis Equitymaster is dedicated towards making its readers- smarter, more confident and richer every day. Here's why hundreds of thousands of readers spread across more than 70 countries Trust Equitymaster.
PREMIUM PRODUCTS
QUICK LINKS
POPULAR TOPICS
- Multibagger Penny Stocks
- Basics of Value Investing
- Benjamin Graham
- How to Invest in Gold
- How to Invest in Silver
- Best Stocks to Buy Today
- Best Small-cap Stocks to Buy
- Best Bluechip Stocks to Buy
- Guide to Penny Stocks
- How to Invest in the Share Market
- Warren Buffett - The Value Investor
- Pick the Best Multibagger Stocks
TRENDING TOPICS
 Donate to credible NGOs in the sector of your choice (ii) Claim 50% tax benefit u/s 80G (iii) Receive periodic reports.")
Copyright © Equitymaster Agora Research Private Limited.
Whitelist | Refer | Terms | Privacy | Contact | About | Sitemap
Equitymaster Agora Research Private Limited (Research Analyst)
SEBI (Research Analysts) Regulations 2014, Registration No. INH000000537.
103, Regent Chambers, Above Status Restaurant, Nariman Point, Mumbai - 400 021. India.
Telephone: +91-22-61434055. Email: info@equitymaster.com. Website: www.equitymaster.com.
CIN:U74999MH2007PTC175407
Name of the Compliance & Grievance Officer: Ms Sonal Ramachandran
Telephone: +91-22-61434003 | Email: compliance@equitymaster.com
LEGAL DISCLAIMER:
Investment in securities market are subject to market risks. Read all the related documents carefully before investing.
Registration granted by SEBI and certification from NISM in no way guarantee performance of the intermediary or provide any assurance of returns to investors.
All rights reserved. Any act of copying, reproducing or distributing this newsletter whether wholly or in part, for any purpose without the permission of Equitymaster is strictly prohibited and shall be deemed to be copyright infringement.
Equitymaster Agora Research Private Limited (Research Analyst) bearing Registration No. INH000000537 (hereinafter referred as 'Equitymaster') is an independent equity research Company. Equitymaster is not an Investment Adviser. Information herein should be regarded as a resource only and should be used at one's own risk. This is not an offer to sell or solicitation to buy any securities and Equitymaster will not be liable for any losses incurred or investment(s) made or decisions taken/or not taken based on the information provided herein. Information contained herein does not constitute investment advice or a personal recommendation or take into account the particular investment objectives, financial situations, or needs of individual subscribers. Before acting on any recommendation, subscribers should consider whether it is suitable for their particular circumstances and, if necessary, seek an independent professional advice. This is not directed for access or use by anyone in a country, especially, USA, Canada or the European Union countries, where such use or access is unlawful or which may subject Equitymaster or its affiliates to any registration or licensing requirement. All content and information is provided on an 'As Is' basis by Equitymaster. Information herein is believed to be reliable but Equitymaster does not warrant its completeness or accuracy and expressly disclaims all warranties and conditions of any kind, whether express or implied. Equitymaster may hold shares in the company/ies discussed herein. As a condition to accessing Equitymaster content and website, you agree to our Terms and Conditions of Use, available here. The performance data quoted represents past performance and does not guarantee future results.
Equitymaster requests your view! Post a comment on "Lupin: The Next Big Breakout?". Click here!
Comments are moderated by Equitymaster, in accordance with the Terms of Use, and may not appear
on this article until they have been reviewed and deemed appropriate for posting.
In the meantime, you may want to share this article with your friends!