
MEMBER'S LOGINX
| Invalid Username / Password | ||||||||
| Invalid Captcha | ||||||||
|
||||||||
| Sign Up | Forgot Password? | ||||||||
Investment in securities market are subject to market risks. Read all the related documents carefully before investing
We're Going On-Air Today:

- Home
- Outlook Arena
- Best Textile Stocks in India
Best Textile Stocks in India

The Indian textile industry is among the oldest industries in the country dating back several centuries.
The industry is also the second largest provider of employment, only next to agriculture. As of 2022, the domestic textile industry constituted 5% of the country's GDP.
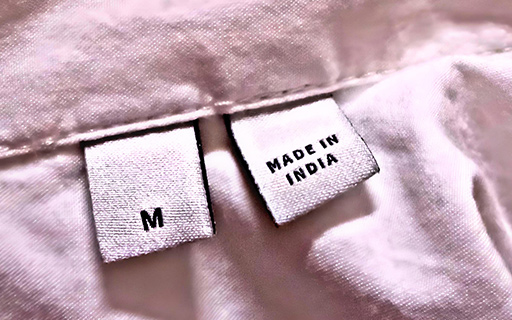
Owing to its labor-intensive nature, the Indian textile industry enjoys a comparative advantage in terms of skilled manpower and cost of production relative to major textile producers.
The Indian textile sector is broadly divided into two groups. These are yarn and fiber, and processed fabrics and apparel.
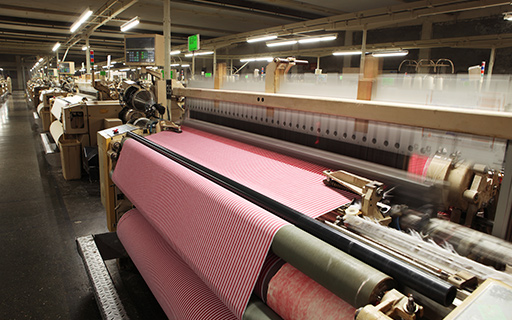
The industry is extremely varied, with the hand-spun and hand-woven textiles sectors at one end of the spectrum and the capital-intensive sophisticated mills sector at the other end of the spectrum.
The growth for this sector is expected to be fueled by support from the Indian government through funding and machinery sponsoring.
In 2021, the Indian government started the product-linked incentive (PLI) scheme for textile industry to expand manmade fabrics and technical textile segment’s value chain.
Further, as export demand and domestic consumption both increases, the retail sector may experience a rapid growth in the coming decade.
Porter’s Five Forces Analysis of the Textile Sector in India
Porter's Five Forces is a model that identifies and analyzes five competitive forces that shape every industry.
These are barriers to entry, bargaining power of suppliers, bargaining power of customers, threat of substitutes and competition within the industry.
A change in any of the forces normally requires a company to re-assess the marketplace.
Let us have a look at how these five forces shape the textile sector -
#1 Barriers to Entry
New companies often bring new resources and can drive down product prices and reduce profitability of the industry.
The most attractive segment is one in which barriers to entry are high as they restrict the threat of new entrants.
Conversely if the barriers are low, the risk of new companies venturing into a given market is high.
In the textile sector, barriers to entry are high. To succeed, one must have superior technology, skilled and unskilled labor, distribution network, and access to global customers.
#2 Bargaining Power of Suppliers
The bargaining power of suppliers is the ability of suppliers to put the firm under pressure. Suppliers may refuse to work with the firm or charge excessively high prices for unique resources.
For the textile sector, the bargaining power of suppliers is low. This is because there is an excess of available suppliers giving them a weak bargaining power.
In addition, the suppliers lack switching costs and have a low level of product differentiation.
#3 Bargaining Power of Customers
The bargaining power of customers is the ability of customers to put the firm under pressure. It is high if buyers have many alternatives and low if they have few choices.
In the textile sector, the bargaining power of customers is low for premium and branded product segments for domestic customers.
For global customers it is high due to the presence of alternate low-cost sourcing destinations.
#4 Competition
For most industries, having an understanding of the competition is vital to successfully marketing a product.
The competition in the textile industry is high. This is because the industry is very fragmented and competition from other low cost producing nations is only going to intensify.
The immense growth opportunities of the sector have led to entrants of large players, even global ones, in the Indian landscape.
#5 Threat of Substitutes
A substitute product uses a different technology to try to solve the same economic need.
This is high for the textile sector. The Indian textile industry faces a threat from low cost producing countries like Pakistan and Bangladesh (as labor cost is around 50% cheaper than India).
Porters Five Forces Analysis of the Textile Sector in India
When to Invest in Textile Stocks in India
India is a key growth market for the textiles sector due to its cost effectiveness, durability and versatility. Hence, it becomes essential for long term investors to understand how and when to invest in textile stocks.
First the when to invest part...
As the demand for textiles is closely linked to the economy - domestic and global, textiles stocks are usually riskier and categorized as cyclical stocks.
Generally considered an offensive tactic in investing, cyclical stocks can be used to generate high returns when the economy is doing well.
Just like the best steel stocks in India, the fortunes of best textile stocks in India are prone to economic booms and busts.
Therefore, the best time to buy textile stocks is during an economic slowdown or when there is overcapacity in some segment of the industry.
Before investing in a textile company, check whether the industry is due for revival or not.
For investors in textile stocks between 2018-2020, the sector was a clear underperformer at the time as it struggled with cheap imports, a consumption slowdown, over capacity, and several other issues.
The situation entirely changed in the next couple of years. Textile stocks have now become multibaggers.
This is because textile players saw increased revenues and margins amid rising consumption.
There were other factors at play too which helped. To name a few:
- The lower dependence on China meant more demand for Indian companies. Buyers adopted a China plus one strategy to shift from China and look for other suppliers.
- And GST council's move to defer rate hike on textiles.
As you can see, many things had to come in place for textile stocks to become as long-term stocks to buy in India.
Key Points to Keep in Mind While Investing in Textile Stocks
Here are a few things to keep in mind while investing in textile stocks.
#1 Cotton and Yarn prices
An increase in cotton price leads to an increase in yarn prices.
When cotton and yarn prices are on the rise, it becomes difficult for the textile companies to pass on raw material costs to buyers. This affects their margin.
Higher prices also make exports uncompetitive. This results in hardships for the exporting companies to fulfil export commitments and taking further orders.
In a scenario where prices are rising, you should focus on companies which can convert cotton to yarn.
Textile companies engaged in the conversion of cotton to yarn not only benefit from increase in margins but also additional demand.
Also, it takes at least 15-18 months to set up a new spinning unit. So, spinning companies have an edge here as compared to conventional textile companies.
#2 Exports as a percentage of revenue
Textile companies that earn a large share of their revenue from exports have better margins as international prices tend to be higher than domestic prices. Although this is not the case every time.
Why we’re adding this point here is that India’s exports are projected to skyrocket in the coming years.
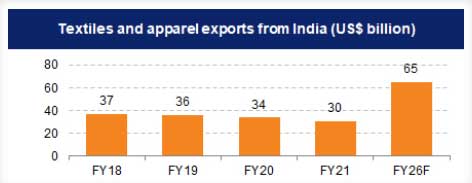
Earlier, countries like China, Bangladesh, and Vietnam were flooding the global markets with cheap products making it difficult for Indian textile companies.
But in 2022, a ban on import of cotton/cotton made products from China to the US opened up a big opportunity for India. This ban resulted in market share gains for Indian textile companies who export.
So before investing in a textile company, see if it focuses more on exports.
#3 Clientele
Textile companies which have a strong global clientele are likely to do well in the long run. Although their contract tenures should be taken into consideration.
For example, Indian textile companies which have contracts which global giants like Walmart, Marks& Spenser, H&M, Zara, and others may have a competitive edge.
#4 Profitability of the company
Before you compare the performance of two textile companies, say for instance, Page Industries vs Monte Carlo, do factor in their operating performance.
Here’s a list of top textile companies in India based on their consolidated net profit.
| (Rs m) | Net Sales | Total Expenditure | Operating Profit | Net Profit |
|---|---|---|---|---|
| Trident Ltd. | 69,192 | 54,570 | 15,100 | 8,150 |
| K.P.R. Mill Ltd. | 40,737 | 30,898 | 10,685 | 7,308 |
| Page Industries Ltd. | 40,206 | 32,337 | 8,078 | 5,365 |
| Nahar Spinning Mills Ltd. | 35,939 | 27,830 | 8,254 | 5,022 |
| Welspun India Ltd. | 67,068 | 58,165 | 9,768 | 3,921 |
| Nitin Spinners Ltd. | 26,923 | 20,407 | 6,535 | 3,261 |
| Vedant Fashions Ltd. | 10,087 | 5,284 | 5,289 | 3,084 |
| Indo Rama Synthetics (India) Ltd. | 39,011 | 36,145 | 3,111 | 2,682 |
| RSWM Ltd. | 38,174 | 33,854 | 4,642 | 2,400 |
| Siyaram Silk Mills Ltd. | 19,031 | 15,688 | 3,687 | 2,125 |
| Rupa & Company Ltd. | 14,287 | 11,616 | 2,778 | 1,908 |
| Century Enka Ltd. | 20,978 | 18,335 | 2,849 | 1,842 |
| Lakshmi Machine Works Ltd. | 30,716 | 28,426 | 3,100 | 1,797 |
| Garware Technical Fibres Ltd. | 11,761 | 9,775 | 2,419 | 1,607 |
#5 Debt to equity (D/E) ratio
A company uses both equity and debt to run a business. However, the amount of debt it uses indicates its fixed obligations. Higher the leverage, higher will be the fixed charges such as interest expense which will lower the profitability.
One must look for a debt to equity ratio of one or less than one.
Here’s a list of top textile companies in India with low debt to equity ratio.
| (Rs m) | Total Debt | Debt to Equity (X) | Free Cashflow |
|---|---|---|---|
| Page Industries Ltd. | 0.0 | 0.00 | 2,131 |
| Vedant Fashions Ltd. | 0.0 | 0.00 | 3,534 |
| K.P.R. Mill Ltd. | 4,179 | 0.16 | 3,657 |
| Trident Ltd. | 15,706 | 0.41 | 4,509 |
| Lakshmi Machine Works Ltd. | 0.0 | 0.00 | 4,720 |
| Welspun India Ltd. | 13,078 | 0.38 | 4,413 |
| Garware Technical Fibres Ltd. | 796 | 0.08 | 577 |
| PDS Ltd. | 88 | 0.05 | 580 |
| TCNS Clothing Co. Ltd. | 0.0 | 0.00 | 346 |
| Kewal Kiran Clothing Ltd. | 766 | 0.16 | 517 |
#6 Return on Capital Employed (ROCE) ratio
Along with a low debt to equity ratio, a one must look for a high return on capital employed (ROCE).
Return on capital employed measures how much profits the company is generating through its capital. The higher the ratio, the better.
An ROCE of above 15% is considered decent for companies that are in an expansionary phase.
Here’s a list of top textile companies in India with more than 15% in ROCE. We have also mentioned other return rations for reference.
| Company Name | ROE (%) | ROCE (%) | ROA (%) |
|---|---|---|---|
| Page Industries Ltd. | 54.4 | 75.2 | 28.2 |
| DCM Nouvelle Ltd. | 50.0 | 42.0 | 24.9 |
| Vedant Fashions Ltd. | 28.4 | 40.4 | 14.3 |
| PDS Ltd. | 39.6 | 38.2 | 29.7 |
| K.P.R. Mill Ltd. | 32.2 | 37.7 | 25.0 |
| Nitin Spinners Ltd. | 45.3 | 36.4 | 18.6 |
| Indo Rama Synthetics (India) Ltd. | 57.5 | 34.9 | 15.9 |
#7 Valuations
Two commonly used financial ratios used in the valuation of metal stocks are -
Price to Earnings Ratio (P/E) - It compares the company’s stock price with its earnings per share. The higher the P/E ratio, the more expensive the stock.
To find stocks with favorable P/E Ratios, check out our list of stocks according to their P/E Ratios.
Price to Book Value Ratio (P/BV) - It compares a firm's market capitalization to its book value. A high P/BV indicates markets believe the company's assets to be undervalued and vice versa.
To find stocks with favorable P/BV Ratios, check out our list of stocks according to their P/BV Ratios.
#8 Dividend yields
There is no consistent trend of dividends across the textile industry, with different companies having different dividend policies.
Here’s a list of top textile companies in India that score well on dividend yield and dividend payout.
| Company | DPS (Rs) | Dividend Yield (%) | Dividend Payout (%) |
|---|---|---|---|
| Kewal Kiran Clothing Ltd. | 19.0 | 9.5 | 143.4 |
| PDS Ltd. | 23.9 | 1.4 | 93.0 |
| Page Industries Ltd. | 370.0 | 0.9 | 76.9 |
| Cheviot Company Ltd. | 60.0 | 5.3 | 45.5 |
| Vedant Fashions Ltd. | 5.0 | 0.5 | 39.4 |
| Gloster Ltd. | 35.0 | 3.2 | 26.3 |
| RSWM Ltd. | 25.0 | 6.1 | 24.5 |
| Lakshmi Machine Works Ltd. | 40.0 | 0.4 | 23.8 |
| Trident Ltd. | 0.4 | 0.7 | 22.5 |
For more details, check out the top stocks offering high dividend yields.
List of Textile Stocks in India
The details of listed metal companies can be found on the NSE and BSE website. However, the overload of financial information on these websites can be overwhelming.
For a more direct and concise view of this information, you can check out our list of textile stocks.
You can also check out the latest textile sector results.
Best Sources for Information on the Indian Textile Sector
Indian Brand Equity Foundation Textile Sector Report - https://www.ibef.org/industry/textiles
Ministry of Textiles - http://texmin.nic.in/
Department of Industrial Policy and Promotion - https://dpiit.gov.in/
So there you go. Equitymaster's detailed guide on the best textile stocks in India is simple and easy to understand. At the same time, it offers detailed analysis of both the sector and the top stocks in the sector.
Here's a list of articles and videos on the textile sector and top textile stocks in India. This is a great starting point for anyone who is looking to explore more about textile stocks and the textile sector.
Disclaimer: This article is for information purposes only. It is not a stock recommendation and should not be treated as such. Learn more about our recommendation services here...
![]() 3 Stocks Bought by Promoters
3 Stocks Bought by Promoters

Feb 26, 2026
Here is a look at three stocks where promoters enhanced their stake, signifying confidence in the company.
![]() 5 Mutual Funds Invested in Textile Stocks
5 Mutual Funds Invested in Textile Stocks

Feb 4, 2026
These mutual funds hold textile stocks, reflecting their view on the sector's recovery and long-term growth.
![]() 3 Fastest Growing Textile Stocks in India
3 Fastest Growing Textile Stocks in India

Jan 29, 2026
Here is a list of the three fastest growing textile stocks in India over the last 5 years.
![]() Why Trident Share Price is Rising
Why Trident Share Price is Rising

Jan 8, 2026
Trident's shares jump 6% bucking market weakness. Here's why.
![]() 5 Textile Stocks with Strong Growth Plans
5 Textile Stocks with Strong Growth Plans

Oct 25, 2025
India's textile industry is entering a new growth phase driven by capacity expansion, value addition and operational efficiency. These five companies are leading that shift with clear growth strategies and disciplined execution.
![]() Why Textile Stocks are Rising
Why Textile Stocks are Rising

Oct 23, 2025
From fabric to fortune - Why textile companies are weaving success on stock markets?
![]() Why Textile Stocks Are Rising
Why Textile Stocks Are Rising
Sep 10, 2025
Textile stocks are rising and at some pace. Here are some reasons why textile stocks are rising.
![]() Why Textile Stocks are Falling
Why Textile Stocks are Falling
Jul 31, 2025
The shares of the textile companies have come under pressure today. What's behind this downward momentum?
![]() 4 Indian Textile Stocks to Watch as US Imposes 35% Tariff on Bangladesh
4 Indian Textile Stocks to Watch as US Imposes 35% Tariff on Bangladesh

Jul 9, 2025
US tariff on Bangladesh may spark opportunity for these 4 export-focused Indian textile companies.
![]() 7 Stocks that Could Benefit from India -UK FTA
7 Stocks that Could Benefit from India -UK FTA

May 10, 2025
7 stocks positioned to benefit as India-UK Free Trade Agreement opens new export opportunities.
![]() Why Textile Stocks Are Falling
Why Textile Stocks Are Falling

Feb 10, 2026
After the India-US trade deal was announced, textile stocks fell. Read on...
![]() Why Gokaldas Exports Share price is Rising
Why Gokaldas Exports Share price is Rising

Feb 3, 2026
Gokaldas Exports' shares rallies 20% in the trade today. Here's why.
![]() Ace Investor Mukul Agrawal Trims Stake in Smallcap Textile Stock
Ace Investor Mukul Agrawal Trims Stake in Smallcap Textile Stock

Jan 13, 2026
Mukul Agrawal trims stake in this small-cap stock for the second consecutive quarter. Here's why...
![]() 3 Fundamentally Strong Textile Stocks to Watch Out For
3 Fundamentally Strong Textile Stocks to Watch Out For

Nov 19, 2025
Here are a few undervalued textile stocks to consider. Some of these have a long-standing track record.
![]() Where Will Kitex Garments be in the Next 3 years?
Where Will Kitex Garments be in the Next 3 years?
Oct 25, 2025
Kitex is entering a new growth phase through large-scale expansion, diversification, and business restructuring.
![]() US-India Trade Deal: The Outlook for the Textile Sector
US-India Trade Deal: The Outlook for the Textile Sector

Sep 13, 2025
What's the outlook for textile stocks as India and the US look to sign a trade deal.
![]() Why Vardhman Textiles Share Price is Rising
Why Vardhman Textiles Share Price is Rising
Aug 28, 2025
Vardhman Textiles is on a winning streak, climbing 13% today. What's fueling this impressive run?
![]() 3 Textile Penny Stocks in India to Add to Your Watchlist
3 Textile Penny Stocks in India to Add to Your Watchlist

Jul 11, 2025
India's textile sector is booming-these penny stocks might offer early entry into that growth story.
![]() 4 Fast Growing Textile Stocks to Keep on Your Watchlist
4 Fast Growing Textile Stocks to Keep on Your Watchlist

May 18, 2025
In light of the recent India UK FTA, here are four textile companies which should be on your watchlist.
![]() 5 Indian Textile Stocks That Could Gain from US Tariffs in 2025
5 Indian Textile Stocks That Could Gain from US Tariffs in 2025
Apr 23, 2025
These five export-focused textile companies are well-positioned to benefit from the US tariff shifts away from China, Vietnam and Bangladesh.
ABOUT EQUITYMASTER
Since 1996, Equitymaster has been the source for honest and credible opinions on investing in India. With solid research and in-depth analysis Equitymaster is dedicated towards making its readers- smarter, more confident and richer every day. Here's why hundreds of thousands of readers spread across more than 70 countries Trust Equitymaster.
PREMIUM PRODUCTS
- Hidden Treasure
- Forever Stocks
- Big Wave Profits
- Equitymaster Venture
- Microcap Millionaires
- Momentum Profits
- Double Income
- Midcap Value Alert
- Exponential Profits
- Annual Breakout Alert
- Lazy Millionaire
- Phase One Alert
- InsiderPro Stocks
- StockSelect
- Private Briefing
- Active Wealth Multiplier 2030
- FundSelect
QUICK LINKS
POPULAR TOPICS
- Multibagger Penny Stocks
- Basics of Value Investing
- Benjamin Graham
- How to Invest in Gold
- How to Invest in Silver
- Best Stocks to Buy Today
- Best Small-cap Stocks to Buy
- Best Bluechip Stocks to Buy
- Guide to Penny Stocks
- How to Invest in the Share Market
- Warren Buffett - The Value Investor
- Pick the Best Multibagger Stocks
TRENDING TOPICS
- Best Defence Stocks in India
- Upcoming Dividend Stocks
- Best Semiconductor Stocks in India
- Data Center Stocks in India
- Best Railway Stocks in India
- Best Solar Stocks in India
- Fastest Growing Stocks in India
- List of BSE Sensex 30 Stocks
- Adani Group Shares
- Stocks Recently Bought by FIIs in India
- Top Value Stocks in India
 Donate to credible NGOs in the sector of your choice (ii) Claim 50% tax benefit u/s 80G (iii) Receive periodic reports.")
LEGAL DISCLAIMER:
Investment in securities market are subject to market risks. Read all the related documents carefully before investing.
Registration granted by SEBI, enlistment with BSE as IA and RA, and certification from NISM in no way guarantee performance of the intermediary or provide any assurance of returns to investors.
All rights reserved. Any act of copying, reproducing or distributing any content from this website whether wholly or in part, for any purpose without the permission of Quantum Information Services Private Limited is strictly prohibited and shall be deemed to be copyright infringement.
Quantum Information Services Private Limited (QIS) is a SEBI registered Research Analyst (bearing registration no INH000021128) and Investment Adviser(Reg. No: INA000000680). Consequent upon the merger of Equitymaster Research Private Limited into QIS, effective October 30, 2025 QIS owns and operates brand 'Equitymaster' and website www.equitymaster.com. This does not constitute or is not intended to constitute an offer to buy or sell, or a solicitation to an offer to buy or sell financial products, units or securities and QIS including its employees, personnel, directors, associates will not be liable for any losses (direct or indirect) incurred or investment(s) made or decisions taken/or not taken based on the information provided herein. All content and information is provided on an 'As Is' basis by QIS. Information herein is believed to be reliable but QIS does not warrant its completeness or accuracy and expressly disclaims all warranties and conditions of any kind, whether express or implied. The services rendered by QIS are on a best effort basis. QIS does not assure or guarantee the user any minimum or fixed returns. The securities quoted, if any are for illustration only and are not recommendatory. Use of this information is at the user's own risk. The user must make his own investment decisions based on his specific investment objective and financial position and using such independent advisors as he believes necessary. This is not directed for access or use by anyone in a country, especially, USA, Canada or the European Union countries, where such use or access is unlawful or which may subject QIS or its affiliates to any registration or licensing requirement.
The performance data quoted represents past performance and does not guarantee future results. As a condition to accessing QIS's content and website, you agree to our Terms and Conditions of Use, available here