
MEMBER'S LOGINX
| Invalid Username / Password | ||||||||
| Invalid Captcha | ||||||||
|
||||||||
| Sign Up | Forgot Password? | ||||||||
- Home
- Views On News
- Dec 15, 2023 - Adani Power vs Tata Power: Which Power Stock is Better for 2024?
Adani Power vs Tata Power: Which Power Stock is Better for 2024?
India's power sector, in terms of installed base, is expected to grow from 418 gigawatts (GW) as of May 2023 to 692 gigawatts by 2028, clocking a compounded annual growth rate (CAGR) of 10.6%.
Supportive government policies and rising electricity demand are expected to drive this growth in the medium term.
Moreover, the Electricity (Amendment) Bill, 2022 will be a game changer. The amendment will allow graded revision in tariff over a year.
It has also proposed a suitable commission for setting up the maximum and minimum tariff.
With ambitious renewable energy targets, the Indian government is also committed to increasing the share of renewables in the overall energy mix.
To provide incentives and support in this regard, the government has come up with policies such as the National Solar Mission and the National Wind Energy Mission.
Furthermore, incentives are also provided via numerous state-level renewable energy policies. The government targets to achieve 500 GW of installed renewable energy capacity by 2030.
Within this sector, there are two prominent companies trying to capture this market - Adani Power and Tata Power.
In this article, we will be comparing both these companies to find out which one is better.
Business Overview
# Adani Power
Adani Power is one of India's largest private thermal power producers having a power generation capacity of 152.5 GW.
Its power plants are spread across states like Gujarat, Maharashtra, Karnataka, Rajasthan, Chhattisgarh, Madhya Pradesh, and Jharkhand.
It also has a 40 MW solar power project in Gujarat.
Adani Power is the world's first company to set up a coal-based supercritical thermal power project registered under the Clean Development Mechanism of the Kyoto Protocol.
# Tata Power
Tata Power Company is India's largest vertically integrated power company which is in the business of power generation, transmission, and distribution.
It aims to produce electricity mainly through renewable sources.
Apart from this, it also manufactures solar roofs.
Moreover, it is also India's #1 electric vehicles (EV) charging company with over 4,900 public charging stations and more than 65,640 home chargers installed to date across 178 cities.
| Particulars | Adani Power | Tata Power |
|---|---|---|
| Market Cap (in Rs Million)* | 20,00,000 | 10,60,000 |
| Installed/Managed Energy Capacity (GW) | 153 | 144 |
| Renewable energy portfolio (MW)* | 40 | 7,800 |
| *As on 12th December 2023 | ||
Adani Power is the bigger company among the two with a market capitalisation of Rs 2 trillion. The market capitalisation of Tata Power is Rs 1.1 trillion.
Although Adani Power has the highest installed or managed energy capacity, Tata wins when it comes to renewables portfolio.
The maximum energy that Adani Power generates is through thermal power.
However, the future of the power sector is more likely to be driven by renewable energy stocks, here Tata Power has an edge over Adani Power.
Adani Power Vs Tata Power
To understand which power stock is better among the two, we have put them through a test.
Here we have tested both these stocks based on their profitability, operational efficiency, financial efficiency, dividends, and valuations.
For profitability, operational efficiency, financial efficiency, and dividend yield, we took the 5-year median of all the parameters.
Profitability
| Gross Profit (in Rs Million) | 19-Mar | 20-Mar | 21-Mar | 22-Mar | 23-Mar | 5-Year CAGR |
|---|---|---|---|---|---|---|
| Adani Power | 66,845 | 77,984 | 1,04,107 | 1,17,606 | 1,25,587 | 13.40% |
| Tata Power | 1,03,687 | 1,17,106 | 1,21,323 | 1,49,840 | 1,71,494 | 10.60% |
| EBITDA (in Rs Million) | 19-Mar | 20-Mar | 21-Mar | 22-Mar | 23-Mar | 5-Year CAGR |
| Adani Power | 74,313 | 70,594 | 1,05,967 | 1,37,895 | 1,43,119 | 14.00% |
| Tata Power | 71,313 | 85,063 | 74,419 | 84,364 | 91,446 | 5.10% |
| PAT (in Rs Million) | 19-Mar | 20-Mar | 21-Mar | 22-Mar | 23-Mar | 5-Year CAGR |
| Adani Power | -9,844 | -22,748 | 12,700 | 49,116 | 1,07,266 | 61.20% |
| Tata Power | 27,315 | 17,267 | 14,849 | 26,234 | 38,097 | 6.90% |
As can be seen in the above table, Adani Power shows better profitability compared to Tata Power. However, the Tata group company has shown consistency whereas in case of Adani Power, there have been instances of losses.
In terms of gross profit, Adani Power beats Tata Power as it is better at controlling power generation and distribution costs.
Since 2021, Adani Power has managed to keep the costs lower relative to its net sales.
| Power generation and distribution cost as a % of net sales | Mar-19 | Mar-20 | Mar-21 | Mar-22 | Mar-23 |
|---|---|---|---|---|---|
| Adani Power | 72.00% | 70.50% | 60.30% | 57.60% | 67.60% |
| Tata Power | 65.30% | 59.80% | 62.90% | 65.00% | 68.9% |
Although the EBITDA growth of Adani Power beats Tata Power, its EBITDA growth fell substantially due to increased general & administration expenses.
Relative to the financial year 2022, the general & administration expenses increased by 90% to Rs 4,547 million (m). This can turn worse if we exclude the other income from the EBITDA.
As of FY23, other income of Adani Power contributes approximately 10% of the total income, while the same number is around 3% for Tata Power.
In terms of PAT as well Adani Power outpaces Tata Power by a huge margin.
The substantial difference between the PAT performance of both companies is due to 2 major reasons:
- Adani Power turned from a net loss to a net profit company.
- In FY23, Adani Power had a tax credit of Rs 30,519 m.
So, if we remove the effect of tax credit and consider 25% tax, Adani Power's PAT works out to be Rs 57,560 m.
This translates to a 5-year CAGR of 42%, which still is a lot higher than Tata Power. Hence, Adani Power is a clear winner when it comes to profitability.
Operational Efficiency
| Net Sales (in Rs Million) | 19-Mar | 20-Mar | 21-Mar | 22-Mar | 23-Mar | 5-Year CAGR |
|---|---|---|---|---|---|---|
| Adani Power | 2,38,842 | 2,64,677 | 2,62,215 | 2,77,112 | 3,87,733 | 10.20% |
| Tata Power | 2,98,811 | 2,91,364 | 3,27,033 | 4,28,157 | 5,51,091 | 13.00% |
| Gross Profit Margin | 19-Mar | 20-Mar | 21-Mar | 22-Mar | 23-Mar | 5-Year CAGR |
| Adani Power | 28.00% | 29.50% | 39.70% | 42.40% | 32.40% | 3.00% |
| Tata Power | 34.70% | 40.20% | 37.10% | 35.00% | 31.10% | -2.20% |
| EBITDA Margin | 19-Mar | 20-Mar | 21-Mar | 22-Mar | 23-Mar | 5-Year CAGR |
| Adani Power | 31.10% | 26.70% | 40.40% | 49.80% | 36.90% | 3.50% |
| Tata Power | 23.90% | 29.20% | 22.80% | 19.70% | 16.60% | -7.00% |
Despite having higher generation or installed capacity, Adani Power loses to Tata Power when it comes to net sales growth.
In the last five years, Tata Power's net sales jumped almost 2 times, while Adani Power's net sales jumped around 1.6 times. It is renewables that contributed to Tata Power's net sales growth.
As of the first half of FY24, renewables contributed approximately 14% to Tata Power's net sales. Moreover, the net sales from renewables jumped 15% YoY.
Adani Power beats Tata Power in gross profit margin due to better management of power generation and distribution costs. All thanks to its higher other income.
| EBITDA Margin (Excl. Other Income) | 19-Mar | 20-Mar | 21-Mar | 22-Mar | 23-Mar | 5-Year CAGR |
|---|---|---|---|---|---|---|
| Adani Power | 20.70% | 21.50% | 33.10% | 35.40% | 25.90% | 4.60% |
| Tata Power | 22.50% | 27.20% | 21.40% | 17.50% | 13.90% | -9.10% |
If we compare their EBITDA margins excluding other income, Adani Power still beats Tata Power.
With this, it's clear that even in terms of operational efficiency, Adani Power has an edge over Tata Power.
Financial Efficiency
Checking the financial efficiency of the company helps us understand whether the company is efficiently allocating capital.
| Debt-to-Equity Ratio (x) | 19-Mar | 20-Mar | 21-Mar | 22-Mar | 23-Mar | 5-Year CAGR |
|---|---|---|---|---|---|---|
| Adani Power | -191.1 | -29.9 | 4 | 2.6 | 1.4 | -29.30% |
| Tata Power | 3 | 2.8 | 2.2 | 2.1 | 1.7 | -10.60% |
| ROCE | 19-Mar | 20-Mar | 21-Mar | 22-Mar | 23-Mar | 5-Year CAGR |
| Adani Power | 8.60% | 5.20% | 11.60% | 16.10% | 15.80% | 12.80% |
| Tata Power | 12.10% | 10.20% | 9.00% | 10.10% | 13.30% | 1.90% |
| Operating Cash Flows (in Rs Million) | 19-Mar | 20-Mar | 21-Mar | 22-Mar | 23-Mar | 5-Year CAGR |
| Adani Power | 56,104 | 55,976 | 70,144 | 1,02,327 | 84,305 | 8.50% |
| Tata Power | 45,738 | 73,753 | 83,451 | 66,927 | 71,591 | 9.40% |
Even in terms of financial efficiency, both companies have reduced their debt considerably. This is evident with their debt to equity ratio.
Here too Adani Power outshines Tata Power with a relatively lower debt to equity ratio.
Return on capital employed (ROCE) too repeats the same story. Adani Power not only has a higher ROCE than Tata Power, but also its 5-year CAGR is better than Tata Power.
However, Tata Power's operating cash flows seem to be better than Adani Power's. In FY23, Adani Power's operating cash flows were reduced majorly due to higher negative working capital changes.
Dividends
- "The true measure of common stocks values, of course, is not found by reference to price movements alone, but by price in relation to earnings, dividends, future prospects and, to a small extent, asset values." - Benjamin Graham.
The father of value investing is trying to say that along with price movement, earnings and dividends, also matter.
Therefore, considering dividends is equally important along with profitability, operational efficiency, and financial efficiency.
When it comes to dividends Tata Power has a history of offering dividends, while Adani Power has not offered any dividends to date.
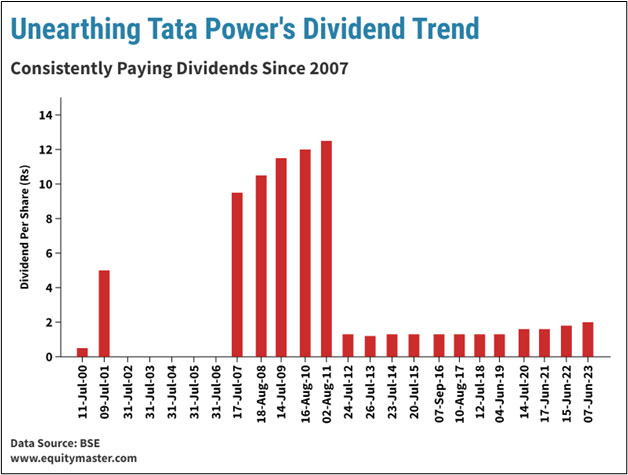
Tata Power has been consistently paying dividends since 2007. You can see a spike in the dividend per share from 2007 to 2011 where its dividend per share was as high as Rs 12.5 while post 2011 you see a big fall.
This is due to the stock split that took place in September 2011. The stock was split from a face value of Rs 10 to Rs 1.
Hence, it is better to look at the dividend yield for a clearer picture.
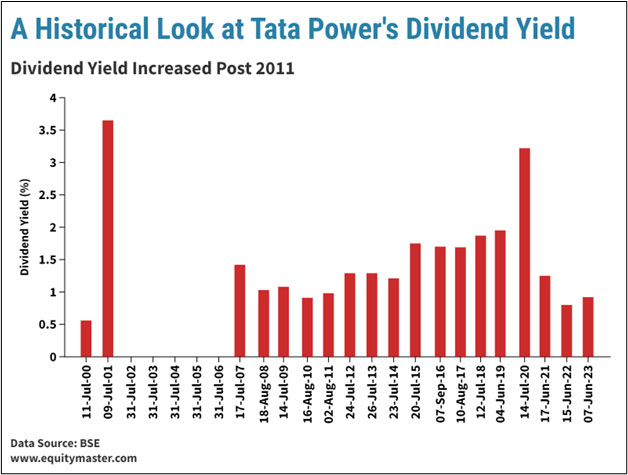
Now, if we look at dividend yield, it has increased post-stock split in 2011. The median dividend yields before and after the stock split is 1% and 1.5%, respectively.
Tata Power's Dividend Payout Ratio (%)
| 19-Mar | 20-Mar | 21-Mar | 22-Mar | 23-Mar | 5-Year CAGR |
|---|---|---|---|---|---|
| 14.9 | 41.2 | 43.9 | 32.1 | 19.2 | 5.10% |
Tata Power has improved its dividend payout from 14.9% in FY19 to 19.2% in FY23. The dividend payout ratio helps us to understand how much of the profits would be distributed as dividends.
Although it is good to invest in companies, not all dividend companies are good and not all non-dividend paying companies are bad.
Some non-dividend paying companies invest profits for growing the business rather than paying out as dividends.
Let us now understand how much money you would have made if you had invested in Tata Power in July 2000.
Investment in Tata Power Since July 2000
| Investment (Rs) | Dividends (Rs) | Current Value (Rs)* | Current Value (Incl. Dividends) (Rs)* | 23-Year CAGR* |
|---|---|---|---|---|
| 10,000 | 25,780 | 2,43,207 | 2,68,987 | 15.40% |
If you had invested Rs 10,000 in Tata Power in July 2000, your investment value would have turned out to be Rs 268,987 (including dividends). This translates to 15.4% CAGR in 23 years.
Taking a step further let us now compare the returns of Adani Power (non-dividend paying company) and Tata Power (dividend paying company).
Adani Power was listed on exchanges on 20th August 2009. So, we have calculated the returns of both companies from their onwards.
| Company | Investment (Rs) | Dividends (Rs) | Current Value (Rs)* | Current Value (Incl. Dividends) (Rs)* | 13-Year CAGR* |
|---|---|---|---|---|---|
| Adani Power | 10,000 | 0 | 36,779 | 36,779 | 10.30% |
| Tata Power | 10,000 | 1,478 | 25,611 | 27,089 | 7.80% |
As can be seen from the above table, despite being a non-dividend paying company, Adani Power gave better returns than Tata Power.
Therefore, rather than getting excited with the higher dividend yields, it is equally important to study the company's fundamentals.
This brings us to another quote...
- "It is an axiom of investment that securities should be purchased because the buyer believes in their soundness, and not because he needs a certain income." - Benjamin Graham.
Here, by income Graham means dividends.
Valuations
Understanding the valuations of the company helps us buy stocks at the right price. This is what we do while buying vegetables. We always look for a good bargain.
Similarly, you should also look out for companies that are available at a good bargain.
To understand a company's valuation, we would be looking at their price-to-earnings (P/E) ratio, price-to-book value (P/B) ratio, market capitalization-to-sales ratio, and enterprise value (EV) by EBITDA ratio.
| Valuations | Adani Power | 5-Year Median | Tata Power | 5-Year Median |
|---|---|---|---|---|
| P/E | 9.7 | 17.7 | 31.4 | 23.7 |
| P/B | 5 | 3.1 | 3.6 | 1.7 |
| Marketcap to Sales | 4.8 | 1.4 | 1.9 | 1.1 |
| EV/EBITDA | 10.4 | 9.2 | 10.9 | 8.7 |
Although Adani Power seems to be attractive due to its lower P/E, it looks expensive from the lens of P/B, Marketcap to Sales, and EV/EBITDA ratios.
Tata Power, on the other hand, turns out to be expensive on all the valuation metrics. This is if we compare them with their respective historical metrics.
However, if we compare them with each other, Tata Power takes the lead. Even though the P/E ratio is one of the widely used valuation metrics, it is important to look at other metrics as well to form a consensus.
Tata Power vs Adani Power - Which Stock is Better?
Speaking fundamentally, Adani Power scores over Tata Power. However, these parameters do not paint a future picture.
It is the company's growth plan and its progress towards it that shows some insights into the future.
Tata Power's target is to expand its distribution business to 40 million customers by the calendar year 2027.
Currently, its renewable business has a capacity of 5.5 GW, among which 2.9 GW of solar and 932 MW of wind capacity is operational.
Furthermore, 785 MW of solar and 900 MW of hybrid capacity is under construction. Moreover, the company targets to increase this to 20 GW by FY27.
Tata Power plans to achieve this by adding 3 GW of capacity each year over the next five years. Also, its 4 GW solar cell and module manufacturing unit in Tamil Nadu is expected to be operational by the third quarter of FY23.
Where Adani Power's focus is to increase its existing capacity to capture the rising demand, Tata Power's focus is on increasing its footprints in the renewables space.
Tata Power is aggressively expanding its renewables portfolio. This is particularly crucial as renewable energy is the future. Even the government's focus is to promote renewable energy and targets to be net zero carbon by 2070.
Still Confused Which is Better?
Use our feature-rich comparison tool, which draws a detailed comparison between any two companies. This tool also includes a graphical analysis making it easy for you to see trends!
You can also compare both the companies with their peers.
Check out the Adani Power Energy factsheet and Tata Power factsheet for a detailed analysis.
You can also check out the latest quarterly results for Adani Power Energy and Tata Power.
Safe Stocks to Ride India's Lithium Megatrend
Lithium is the new oil. It is the key component of electric batteries.
There is a huge demand for electric batteries coming from the EV industry, large data centres, telecom companies, railways, power grid companies, and many other places.
So, in the coming years and decades, we could possibly see a sharp rally in the stocks of electric battery making companies.
If you're an investor, then you simply cannot ignore this opportunity.
Details of our SEBI Research Analyst registration are mentioned on our website - www.equitymaster.comDisclaimer: This article is for information purposes only. It is not a stock recommendation and should not be treated as such. Learn more about our recommendation services here...
Equitymaster requests your view! Post a comment on "Adani Power vs Tata Power: Which Power Stock is Better for 2024?". Click here!
1 Responses to "Adani Power vs Tata Power: Which Power Stock is Better for 2024?"
ABOUT EQUITYMASTER
Since 1996, Equitymaster has been the source for honest and credible opinions on investing in India. With solid research and in-depth analysis Equitymaster is dedicated towards making its readers- smarter, more confident and richer every day. Here's why hundreds of thousands of readers spread across more than 70 countries Trust Equitymaster.
PREMIUM PRODUCTS
QUICK LINKS
POPULAR TOPICS
- Multibagger Penny Stocks
- Basics of Value Investing
- Benjamin Graham
- How to Invest in Gold
- How to Invest in Silver
- Best Stocks to Buy Today
- Best Small-cap Stocks to Buy
- Best Bluechip Stocks to Buy
- Guide to Penny Stocks
- How to Invest in the Share Market
- Warren Buffett - The Value Investor
- Pick the Best Multibagger Stocks
TRENDING TOPICS
 Donate to credible NGOs in the sector of your choice (ii) Claim 50% tax benefit u/s 80G (iii) Receive periodic reports.")
Copyright © Equitymaster Agora Research Private Limited.
Whitelist | Refer | Terms | Privacy | Contact | About | Sitemap
Equitymaster Agora Research Private Limited (Research Analyst)
SEBI (Research Analysts) Regulations 2014, Registration No. INH000000537.
103, Regent Chambers, Above Status Restaurant, Nariman Point, Mumbai - 400 021. India.
Telephone: +91-22-61434055. Email: info@equitymaster.com. Website: www.equitymaster.com.
CIN:U74999MH2007PTC175407
Name of the Compliance & Grievance Officer: Ms Sonal Ramachandran
Telephone: +91-22-61434003 | Email: compliance@equitymaster.com
LEGAL DISCLAIMER:
Investment in securities market are subject to market risks. Read all the related documents carefully before investing.
Registration granted by SEBI and certification from NISM in no way guarantee performance of the intermediary or provide any assurance of returns to investors.
All rights reserved. Any act of copying, reproducing or distributing this newsletter whether wholly or in part, for any purpose without the permission of Equitymaster is strictly prohibited and shall be deemed to be copyright infringement.
Equitymaster Agora Research Private Limited (Research Analyst) bearing Registration No. INH000000537 (hereinafter referred as 'Equitymaster') is an independent equity research Company. Equitymaster is not an Investment Adviser. Information herein should be regarded as a resource only and should be used at one's own risk. This is not an offer to sell or solicitation to buy any securities and Equitymaster will not be liable for any losses incurred or investment(s) made or decisions taken/or not taken based on the information provided herein. Information contained herein does not constitute investment advice or a personal recommendation or take into account the particular investment objectives, financial situations, or needs of individual subscribers. Before acting on any recommendation, subscribers should consider whether it is suitable for their particular circumstances and, if necessary, seek an independent professional advice. This is not directed for access or use by anyone in a country, especially, USA, Canada or the European Union countries, where such use or access is unlawful or which may subject Equitymaster or its affiliates to any registration or licensing requirement. All content and information is provided on an 'As Is' basis by Equitymaster. Information herein is believed to be reliable but Equitymaster does not warrant its completeness or accuracy and expressly disclaims all warranties and conditions of any kind, whether express or implied. Equitymaster may hold shares in the company/ies discussed herein. As a condition to accessing Equitymaster content and website, you agree to our Terms and Conditions of Use, available here. The performance data quoted represents past performance and does not guarantee future results.
Adani power
Dec 17, 2023Hope fully tata power our choice better and thankfully of Indian country of our mind.