- Home
- Outlook Arena
- The Secret to Success in Intra-Day Trading
The Secret to Success in Intra-Day Trading
Don't Miss: Best Chance to Access Midcap Stocks Research at 80% OFF
Economic Times reported that 1.2 million new demat accounts were opened in the month of March and April during the lockdown.
This is a record jump considering that 4.2 million new demat accounts were opened in the 11 months between April 2019 and February 2020.
Out of these 1.2 million new accounts, nearly 3 lakh accounts were opened with Zerodha, which is a discount broker popular among traders.
Most people are drawn to trading because of the availability of free time during the lockdown. It doesn''t take much of an effort to enter the markets.
But it would take hell of an effort to survive and profit from the market.
If you are one of those new to trading then you must know that nearly 90% of traders do not survive more than a year after they start trading.
That''s probably the reason why 75% of the total demat accounts are inactive. (No activity for a year.)
One of the reasons why most traders perish in the first year itself is that they don''t take much effort to learn the art of trading.
At Equitymaster, one of my goals has been to help our readers become the best traders they can be.
As a part of this mission, I have directly interacted with hundreds of traders through our investor conferences and over emails.
I have noticed a common thread among those who have just started trading.
Avoid These 2 Common Mistake New Traders Make
First, they don''t know where and how to look for trades.
Some start with following tips from friends, brokers or media houses. Eventually, they realise none of it works and they need a method of their own.
I have always recommended to focus on price action over anything else. There''s a reason why traders say ''Bhav Bhagvan Che'' - Price is God.
Second, when they begin focusing on price, they don''t know what to look at.
Do they look at daily or weekly charts?
Do they look at candlesticks or bar charts? Haven''t heard of candlesticks before? Here''s a video you must watch on how to interpret candlesticks.
You need a proper system in place, depending on the kind of trader you are, before you start picking trades yourselves.
A Trading System for You
A swing trader would use different charts than a positional or day trader. How do you select the charts that suits you?
If you are a swing trader who buys and holds stocks for 3-20 days with a profit objective of 6-20% then you should pick a daily chart for your analysis or trend determination. All your trading decisions should be based on this chart alone. The chart you pick up for trend determination will become your ''Chart of Choice'' (CoC). Now once you are convinced that the stock you have chosen is worth your hard-earned money...
''STOP''
Don''t be in a hurry to place an order with your broker. Just hold on to your excitement and put your phone back where you picked it up from.
Now once you are settled, just jot down your points/arguments for entering the stock.
Once you are done with it, just check one degree higher time frame chart above your ''CoC'' to CONFIRM whether this chart also reinforces the same view you had about the stock when you analyzed it on your ''CoC''.
In this case, you must check the weekly chart of the stock and confirm your views on a higher time frame.
If it doesn''t confirm, then it''s not the best of things to go ahead with this stock.
On the other hand, If you are convinced that the stock is worth your money, just hold on to your breath and check a lower degree time frame chart for best entry opportunity.
A lower degree chart in this case would be an intraday chart.
Check for a best entry opportunity on intraday charts and then finally place an order with your broker, who will be eager to buy at the market rate but you would stay firm with your price levels and not get influenced with his sweet talk.
Ideal Chart Timeframes Based on Market Participants
| Market Participant | Time in Position | Expected Returns in % per trade | Chart used for | |
|---|---|---|---|---|
| Trend Determination | Entry & Exit Points | |||
| Long term investor | Months to years | 30% and higher | Monthly | Weekly |
| Intermediate term trader | Weeks to months | 12%-30% | Weekly | Daily |
| Swing trader | 3-20 days | 6% - 20% | Daily | Hourly |
| Day trader | Hours | 0.5% - 2% | Hourly | 10-minute |
| Micro trader | Seconds to minutes | A few pips | 5-minute | 1 minute |
Why Day Trading is Complex
I have met people at the Equitymaster Conference, and have even received lot of emails from those who want to start intraday trading. A lot them faced problem on which time frames to use while day trading?
I have found one common mistake across all of them. Most of them start out as swing traders and once they are successful, they move to day trading.
But day trading is where it gets complex and the most common mistake that they make is that they directly jump from daily charts to smaller time frame charts. If a stock looks good on the daily chart, they would try and trade the stock on a lower degree time frame i.e. at five minutes or ten minutes timeframes.
A stock would perform very differently on a daily time frame and on a 5 or 10-minute time frame. Trend determination is difficult on a lower degree time frame like 5 or 10-minute. So, identifying the stock on that time frame, and trading it becomes very difficult.
Therefore, you need a better process to start day trading.
Simplifying Intraday Trading
You might have heard many people use 60-minute time frame for day trading. That might be a good option for anyone who''s training forex, because forex markets are open round the clock. But for some someone who''s trading in the Indian stock market, the 60-minute time frame is not the ideal choice. I''ll tell you why.
Indian markets are open from 9:15 to 3:30. That''s a total period of 375 minutes. Now you cannot divide 375 into equal batches of 60 minutes each. So, the best way to do it is to divide 375 by five and you get 75. You can divide one day''s worth of trading into five equal sessions.
Now this is also important and useful because when you are looking at the weekly chart, it consists of five trading days, so a week is divided into five days, and we are now dividing a day into five batches of 75-minutes each.
And then when you go on the lower degree, you can again divide 75 by five and you get a 15-minute time frame. You can repeat this and divide 15 by 5 and you get a 3-minute time frame.
So, in this case, for anyone who''s doing day trading, the chart of choice for that person would be the 15-minute time frame. You must use it for trend determination.
You can then go on a higher degree time frame like a 75-minute time frame to confirm whether the stock is worth your attention or not.
And once you believe the stock deserves your capital, then you can go on a lower degree time frame like a three-minute time frame for identifying entries as well as exits.
If your broking platform does not allow you to view a 75-minute chart then I would suggest you using a 25 minute time frame, which exactly divides the 75 minute into three sessions. So, you can go with 25, 15, and 5-minute kind of time frames. These time frames are available in most broking platforms.
Identifying Day Trading Opportunities in the Real World
So, let''s see how one could practically use these kinds of time frames to identify trading opportunities on an intraday basis.

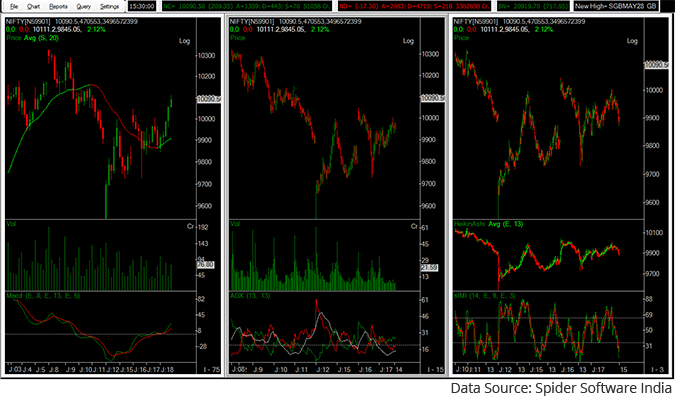
So now you can see my screen. I have a chart of Nifty with all the three time frames that I spoke about. So here in the first panel is the 75-minute chart. The second panel is the 15-minute chart. The third panel is a 3-minute time frame.
You can see as you go on lower time frames, the zigzag nature or the up and down moves can get much more extreme. It would be difficult if you straight away start trading a smaller degree time frame like a 3 or 5-minute time frame from a daily time frame.
So that is the reason why I prefer looking at higher degree time frame first and then only use a smaller degree time frame for picking entries and exits.
I will also reveal what kind of indicators you could use. But before I go into these indicators, I would like to tell you that there is no right or wrong way to use a specific indicator. That''s dependent on the trader''s personal choice of indicators. There are 250 indicators and infinite more that a trader could develop on his own. So, it is completely on his own discretion what kind of indicators to use.
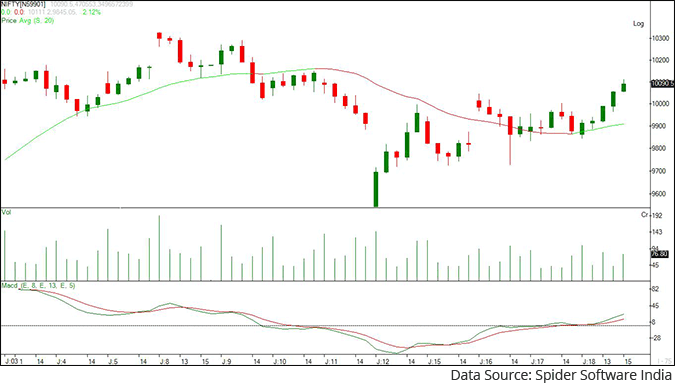
75-minute chart of Nifty

Here is the 75-minute chart. I have plotted a simple 20 day moving average, which helps me determining the trend. If the index is above the moving average then the trend is bullish. If its trading below the average then the trend is bearish.
I also use the moving average convergence-divergence (MACD). Now this is simply an indicator which plots the difference between two moving averages. So, if the shorter term moving average is above the longer term moving average, then the indicator will be above zero and it indicates that the trend is positive. The short-term trend is positive and if this indicator is below zero, then it indicates that the trend is negative.
So, on the 75-minute chart, I use moving average and MACD to determine the trend. I prefer drawing trendlines on 75-minute charts to determine trends along with MACD and moving averages.
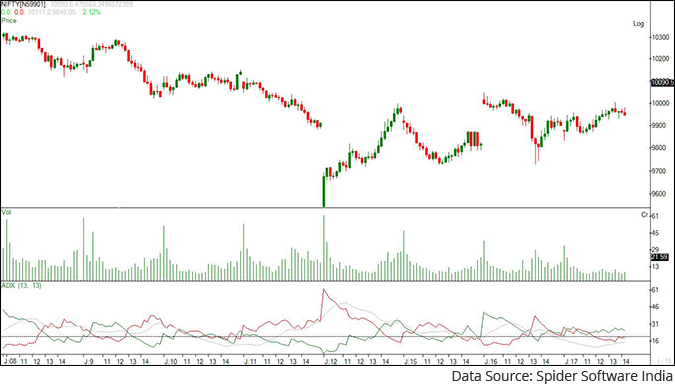
15-minute chart of Nifty

Now, once the trend is determined, whether up, down or sideways, I use a 15-minute chart along with the ADX indicator. This indicator tells you the strength of the trend. It does not tell you whether the market is moving up or down, it only tells you whether there is strength in the market or not.
So, the black line that you can see in the bottom most panel is the ADX indicator. If it is trading above 20 it would indicate there is strength in the market. If it is trading below 20, then it would suggest that market is trading sideways. If it is trading below 20 then there is this limited trend in the market. One should avoid trading such kind of stocks or market.
There is a saying never long or short a dull market. So basically, ADX helps you determine whether the market is buoyant or it is dull.
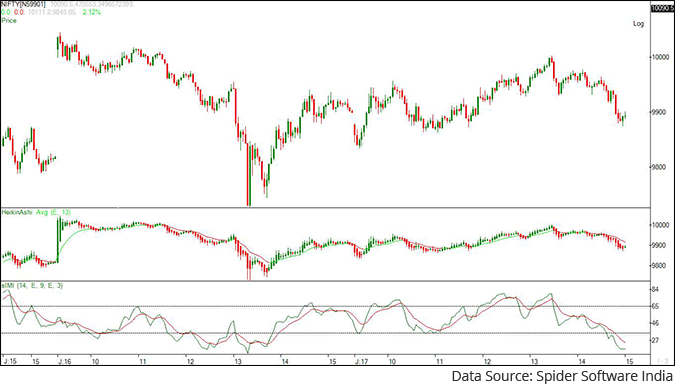
3-minute chart of Nifty

Now let''s move on to a 3-minute time frame. The indicator that I use here is a Relative Strength Index (RSI). It is a bounded oscillator which tells you if the market is overbought or oversold. It is placed in the bottom most panel.
The RSI ranges between 0 and 100. When it''s trading close to 20 it''s considered oversold and when it''s trading near or above 80 its overbought.
So, if you want to buy a stock, then a good time to enter would be when the RSI is the trading closer to its oversold levels. If you want to sell a stock then its best done when its trading near overbought levels.
Apart from the RSI, I also use the Heikin-Ashi candle which you can see in the middle panel. It is a simple version of the same candlestick pattern, but it filters prices in such a way that it makes candlesticks charts more readable and trends easier to analyze.
You can see that the Heikin-Ashi candles are consistently coloured red when the markets are trending lower and in green when they are trending higher.
So that''s how you can use these 3 time frames for analysis along with the indicators. Now you are equipped with a trading system and all the tools required to make the best use of it. All that you will need now is time to practice it.
You can start small and add capital to your trading account as you gain confidence while using this system. I confident that if you trade with proper discipline and risk management with this system it can generate solid profits for you.
I hope this helps article helps you with your analysis and trading and helps you become a better trader.
If you want to learn more about using technical analysis and charts to improve your trading then I recommend you check out our timeless reading section: Fundamentals of Technical Analysis. It''s all in a simple and easy to understand language. I am sure you will find it insightful and enjoy reading it.
Warm regards,

Apurva Sheth
Senior Research Analyst, Fast Profits Report
Equitymaster Agora Research Private Limited (Research Analyst)
FAQs on The Secret to Success in Intra-Day Trading
1. What is the secret of intraday trading?
The secret to day trading is simple. Follow a clear trading strategy.
You see, most intraday traders don't follow any strategy at all. They just 'read the tape' and hope for the best.
Or they trade in anticipation of some news that may move a stock intraday.
Rarely do they have a system to fall back on. If you have one, then you will immediately set yourself apart from 99% of intraday traders in the market.
Your intraday strategy must be based in the competent use of short-term technical charts. These will be 3, 5, 15, 25, and 75 minute charts. We suggest using Heikin Ashi candlestick charts.
You should also use technical indicators that are appropriate for intraday trading. The moving average convergence-divergence (MACD), average directional index (ADX), and Relative Strength Index (RSI) are three good choices.
Finally always trade with a stop loss and follow sound money management principles.
2. Is intra day-trading profitable?
Most intraday traders lose money. This is because they trade without a plan, without a strategy.
Many don't use stop losses. Often, they commit large amounts of capital in a single trade. In such situations, a single bad trade takes a big bite out of their trading capital which is hard to earn back.
To make consistent profits in intraday trading, you need to follow a sound trading strategy. This strategy should be built upon a good grounding in the fundamentals of technical analysis.
It will require some trial and error on your part. It will take some time. But once you have a winning trading strategy, intra-day trading will become profitable.
3. What is the most successful intraday trading strategy?
There is no single strategy that is consistently successful in any form of trading, including intraday trading. Financial markets are dynamic. Traders all around the world are constantly learning and improving their knowledge and skills.
You will need to do the same. Stay up to date with charting techniques and keep learning all the time.
Soon you will be able to develop your own intraday trading strategy which will beat the market.

